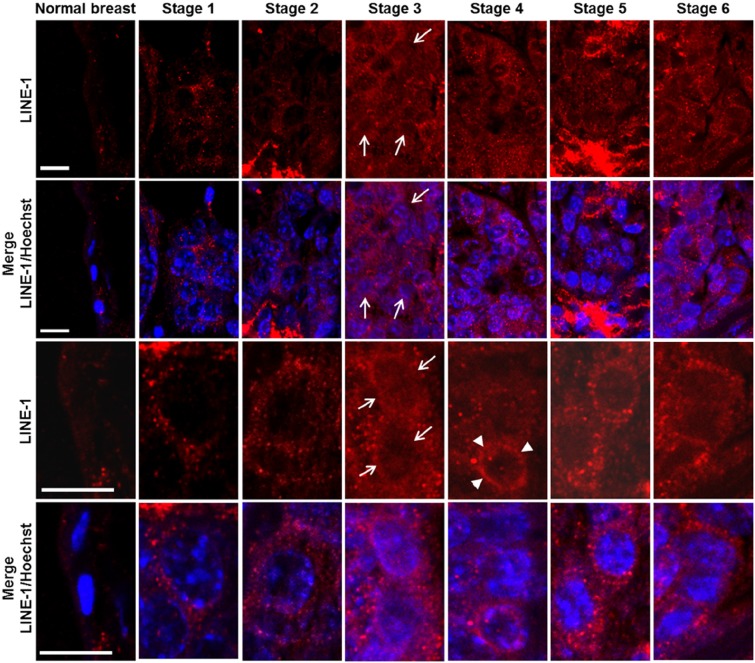
Figure 2. Confocal microscopy of ORF2p intracellular distribution during murine mammary cancer progression.
The top row panels depict ORF2p-specific IF, the bottom rows panels show merged images of LINE-1 ORF2p (red channel) and Hoechst-counterstained nuclei (blue channel). The arrows point to LINE-1 ORF2p positive nuclei and arrowheads to perinuclear accumulation of LINE-1 ORF2p. Panels in rows 3 and 4 show high magnification image details. Bars, 10 micrometers.

