
Figure 4. Transcription of SINE B1 and LINE-1 RNA in normal breast tissue (NB) and at the indicated stages of tumor of progression.
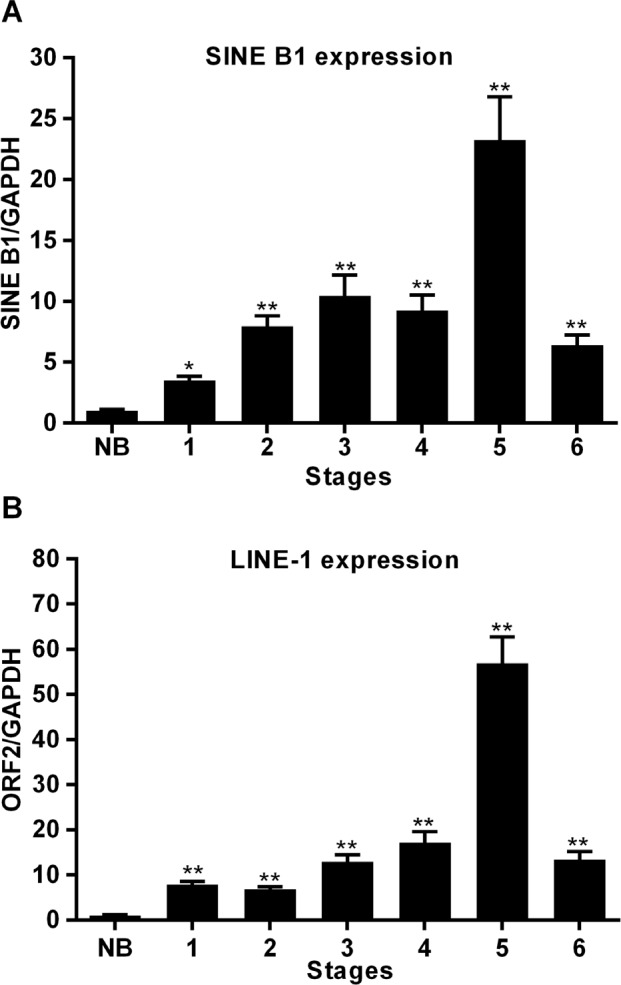
A. SINE B1 transcribed RNA. B. LINE-1 transcribed RNA. Transcription values were assessed by qRT-PCR and normalized to gapdh. Mean and SD values were calculated from three independent RT-PCR reactions, each in triplicate. ** Highly significant differences, * significant differences, compared to values from NB breast tissue.