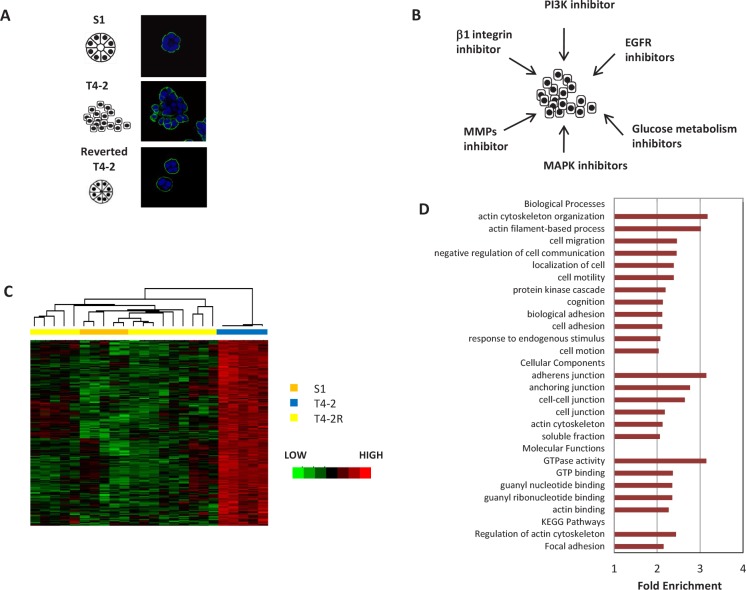
Figure 1. A cluster of genes revealed by microarray analysis is associated with tissue polarity in HMT3522 cell lines.
A) Immunofluorescence analysis of basal marker alpha6-integrin in S1, T4-2, and T4-2 cells phenotypically reverted in 3D culture. S1 and reverted T4-2 cells formed polarized spheroids, but T4-2 cell formed disorganized structures. Blue:DAPI, green: alpha6 integrin. Scale: 25μm B) Scheme showing the pathways that were blocked to reverse the malignant phenotypes of T4-2 cells in 3D culture for the microarray analysis. C) Unsupervised clustering of the 180 genes upregulated in T4-2 cells as compared to S1 cells and reverted T4-2 cells. D) Gene Ontology terms (biological processes, cell components, molecular functions) and KEGG pathways overrepresented in the disorganization gene signature.

