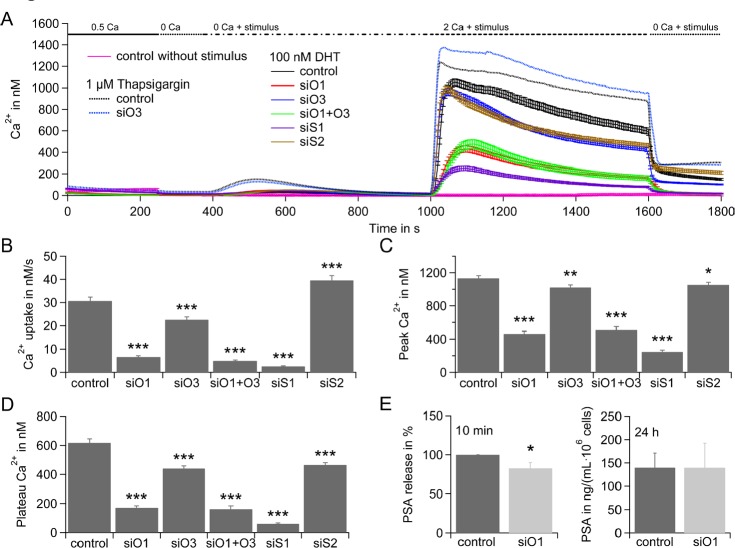
Figure 2. Rapid DHT response in LNCaP depends on SOCE.
A) Average intracellular Ca2+ responses (±SEM) from a Fura-2 based Ca2+ imaging assay when stores are depleted by application of 100 nM DHT (solid lines) and cells were transfected with control RNA (control, black curve, n = 132), Orai1 siRNA (siO1, red curve, n = 117), Orai3 siRNA (siO3, blue curve, n = 126), Orai1 and Orai3 siRNA (siO1+O3, green curve, n = 77), STIM1 siRNA (siS1, purple curve, n = 137), STIM2 siRNA (siS2, brown curve, n = 180), or stores are depleted by application of 1 μM tg (dotted line) and cells were transfected with control RNA (control, black curve, n = 228) or Orai3 siRNA (siO3, blue curve, n = 227) or stores were not depleted (no stimulus) and transfected with control RNA (pink curve, n = 45). Extracellular Ca2+ concentration is indicated in mM. B) Average Ca2+ influx rates from cells in A, when 100 nM DHT and 2 mM Ca2+ were applied. C) Average Ca2+ peaks from cells in A, when 100 nM DHT and 2 mM Ca2+ were applied and baseline for every cell was subtracted. D) Average Ca2+ plateaus from cells in A, when 100 nM DHT and 2 mM Ca2+ were applied and baseline for every cell was subtracted. E) PSA concentration in the media 10 min after stimulation with 100 nM DHT (double determination in n = 5 experiments) and PSA concentration in the media 24 h after stimulation with 100 nM DHT (double determination in n = 3 experiments) when cells were transfected with control RNA or Orai1 siRNA.

