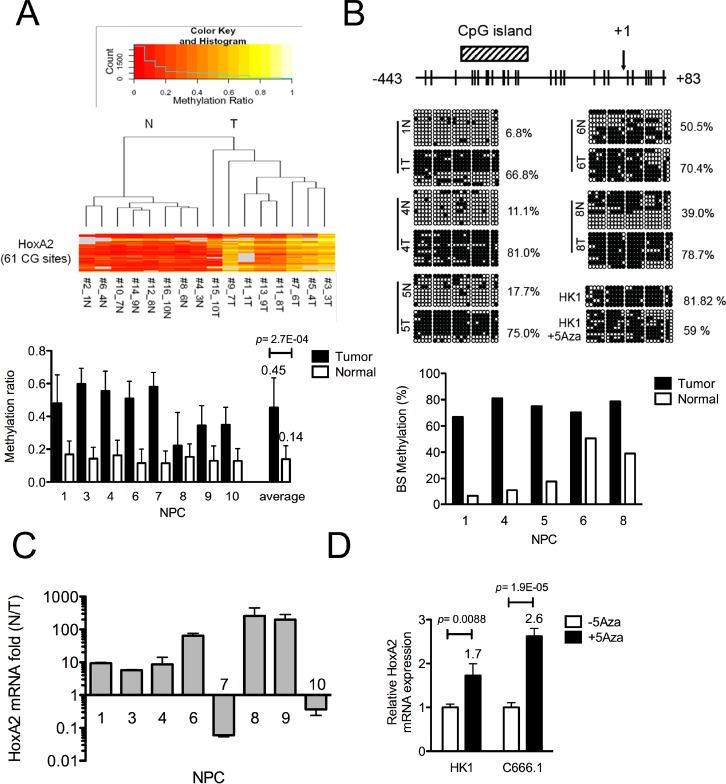
Figure 1. Identification of the HOXA2 gene as differentially methylated in NPC.
(A) Three fragments covering the 61 CpG sites in the HOXA2 promoter (−1492~+17) were amplified from 8 paired NPC samples and analyzed by MassArray (Sequenom®). The colored histogram represents the CpG methylation ratio, ranging from 0 (0% methylated CpG site, red) to 1.0 (100% methylated CpG site, yellow). Each horizontal lane denotes the methylation ratio of a given CpG site in NPC tumor and adjacent normal tissues. The right panel shows the averaged methylation ratio of each sample. (B) Schematic map containing a CpG island (−345~−205, diagonal region) of the HOXA2 promoter, as adapted from the MethPrimer website [15]. The transcription start site (+1) and 22 CpG sites (vertical bars) are indicated. Bisulfite sequencing analysis was performed on −443~+83 in 5 paired NPC clinical samples. Each horizontal row represents a single clone; the methylation percentages of at least 8 individual clones are indicated, with unmethylated (○) and methylated (●) CpG sites. The lower panel shows the methylation percentage for each sample. (C) Q-RT-PCR analysis of HOXA2 mRNA expression was performed on the 8-paired NPC samples, and the results were normalized with respect to GAPDH expression. The columns represent the relative HOXA2 mRNA expression fold-change in log value (N/T). (D) Columns represent the Q-RT-PCR data of relative fold-change of restored HOXA2 mRNA expression normalized with respect to GAPDH expression in NPC cell lines (HK1, C666.1) (+/−) 10μM 5'Aza treatment.

