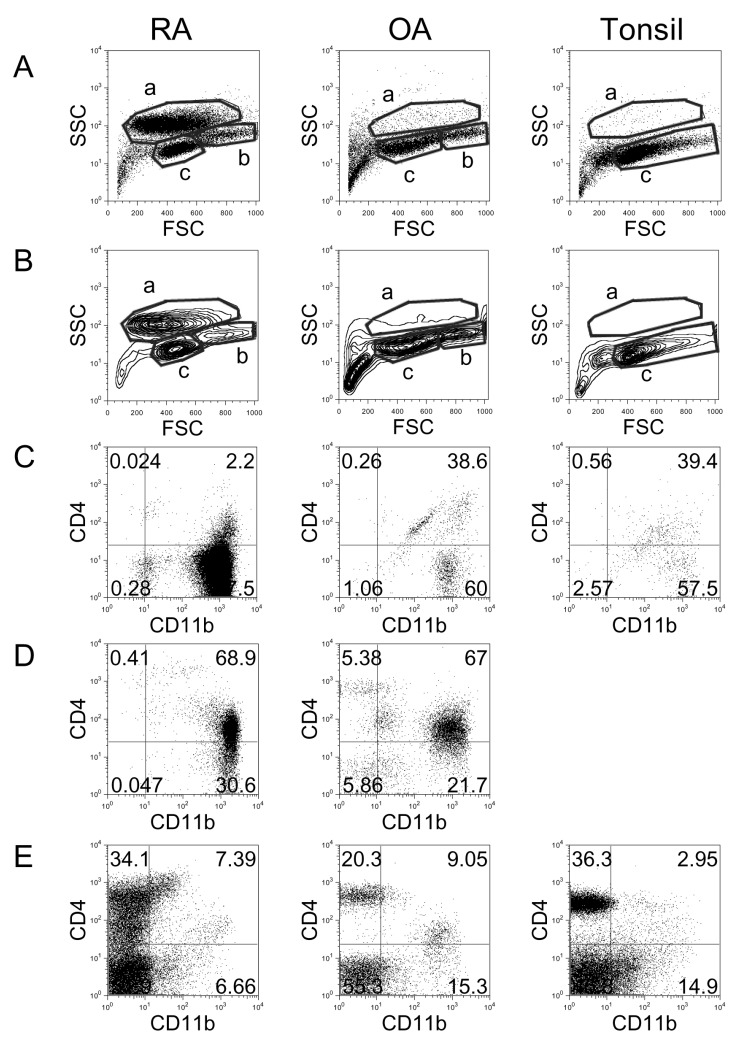
Figure 1.
Flow cytometric analysis of cell populations in RA, OA, and tonsil showing by dot plots (A) and contour plots (B). X-axis shows forward-scattered light (FSC) and Y-axis shows side-scattered light (SSC). The cell populations were costained with anti-CD11b and anti-CD4 and analyzed in 'a' area of A and B (C), 'b' area of A and B (D), and 'c' area of A and B (E). The results are representative of each RA (n=17), OA (n=3), and tonsil (n=14) group.

