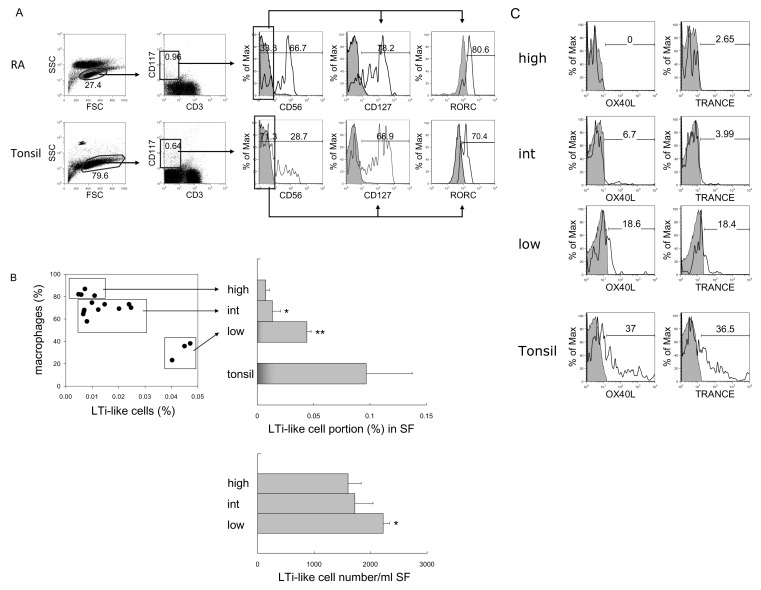
Figure 4.
Identification and comparison of LTi/LTi-like cells in RA and tonsil. (A) Flow cytometric analysis of LTi-like cells. According to FSC and SSC, lymphocytes were selected and CD3-negative and CD117-positive population were gated. The expression of CD127 and RORC in CD117+CD3-CD56- cells was analyzed. Shaded histograms indicate isotype staining. (B) Correlation between the portion of macrophages and LTi-like cells in synovial fluid (SF). Percentage and absolute cell numbers of LTi-like cells in macrophage-high, intermediate (int), and low groups of RA synovial fluid were compared with tonsils. The statistical evaluation of the data was performed with Student's t-test and one-way analysis of variance. *p<0.05, and **p<0.005 compared to macrophage-high group. (C) Expression of OX40L and TRANCE in LTi-like cells in macrophage-high, intermediate, and low groups of RA synovial fluid and tonsil. Shaded histograms indicate isotype staining.

