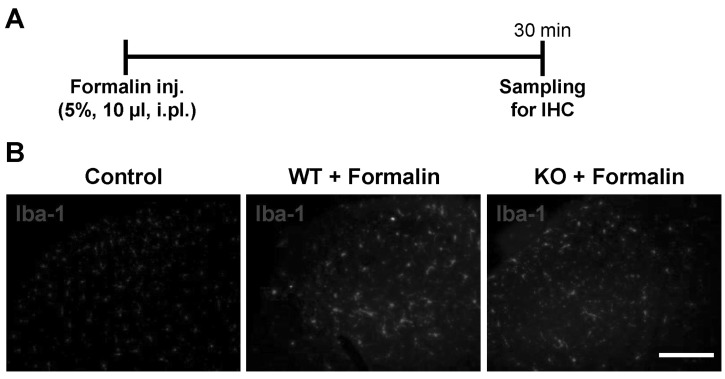
Figure 2.
Reduction of microglial activation in Lcn2 KO mice. (A) The lumbar segment (L4-6) of the spinal cord is sampled 30 min after the intraplantar injection of formalin (5%, 10 µl) as shown in the experimental timeline. (B) Photomicrographs showing Iba-1 immunoreactivity in the dorsal horns of the ipsilateral lumbar spinal cords of WT and Lcn2 KO mice. The results are representative of at least three independent experiments. Scale bars=200 µm.

