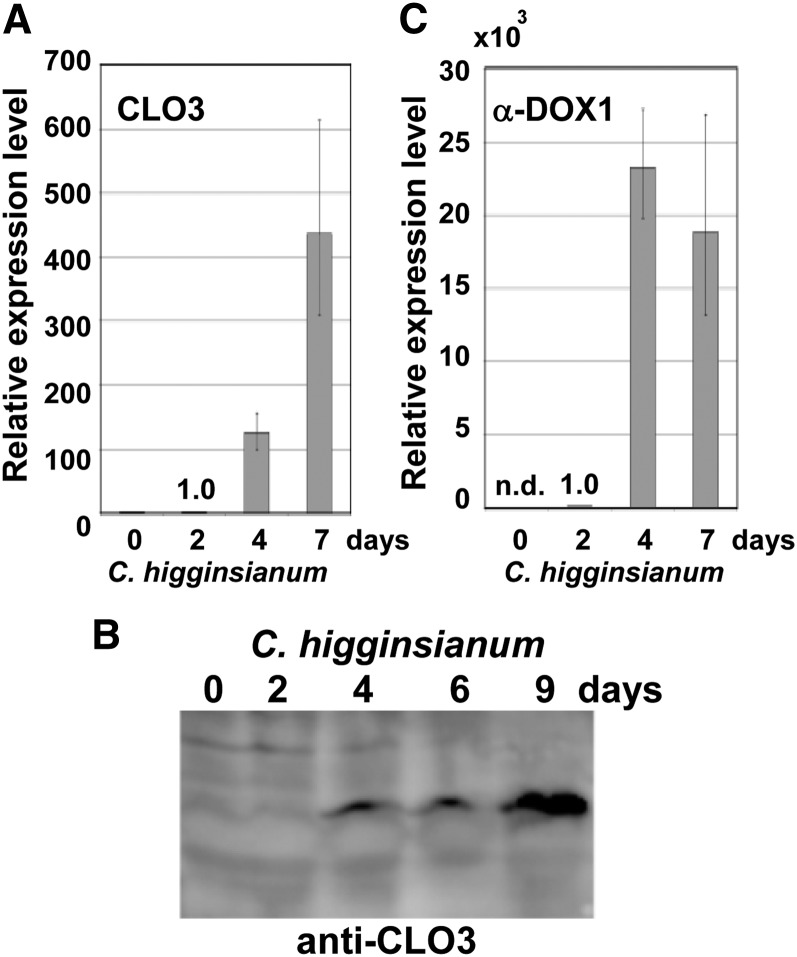
Figure 2.
CLO3 and α-DOX1 are induced remarkably after infection with C. higginsianum. A, mRNA levels of CLO3 in whole leaves after fungal infection. The mRNA level at 2 d was defined as 1.0. Vertical bars indicate the 95% confidence intervals for three experiments. The ACTIN2 gene was included as a control. B, Changes in the levels of the CLO3 protein in response to infection with C. higginsianum. Extracts from leaves infected with C. higginsianum were subjected to immunoblotting with a specific antibody against CLO3. C, mRNA levels of α-DOX1 in whole leaves after fungal infection. The mRNA level at 2 d was defined as 1.0. Vertical bars indicate the 95% confidence intervals for three experiments. The ACTIN2 gene was included as a control. n.d., Not detected.

