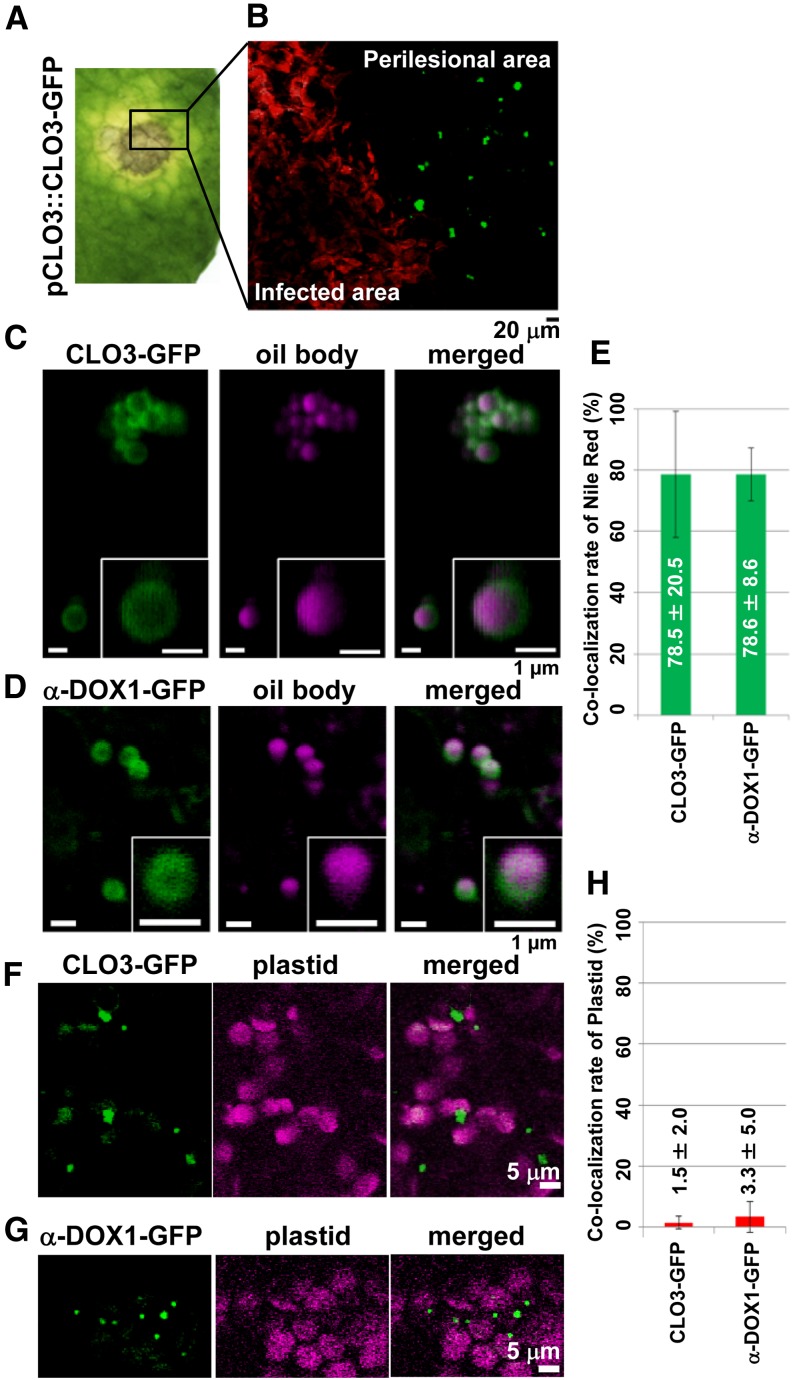
Figure 3.
CLO3 and α-DOX1 localize to leaf oil bodies of the perilesional area after infection with C. higginsianum. A, Leaves of transgenic plants expressing CLO3-GFP under the control of the endogenous CLO3 promoter were infected with C. higginsianum. The yellow perilesional area surrounds the infected area 4 d after infection. B, Fluorescence image of a section of the infected leaf in A showing that the detection of CLO3-GFP was limited to the perilesional area (an area free of fungi) and was not observed in areas where RFP-labeled fungi proliferated. C, Localization of CLO3-GFP on the surface of oil bodies stained with Nile red in the perilesional area of a 4-d-infected leaf. Insets show magnified views. D, Localization of α-DOX1-GFP on the surface of oil bodies stained with Nile red in the perilesional area of a 6-d-infected leaf of a transgenic plant expressing α-DOX1-GFP under the control of the endogenous α-DOX1 promoter. Insets show magnified views. E, Quantitative analysis of the rate of oil bodies labeled with CLO3-GFP (C) or α-DOX1-GFP (D). A total of 73 oil bodies in three fluorescence images of CLO3-GFP and a total of 101 oil bodies in five fluorescence images of α-DOX1-GFP were examined in 4-d-infected leaves. Data represent average values ± sd (error bars). F and G, Autofluorescence images of plastids and GFP fluorescence images of CLO3-GFP (F) and α-DOX1-GFP (G) in the perilesional area of 4-d-infected leaves. H, Quantitative analysis of the rate of CLO3-GFP-positive dots (F) or α-DOX1-GFP-positive dots (G) overlapped with autofluorescence images of plastids. A total of 135 CLO3-GFP-positive dots in five fluorescence images and a total of 210 α-DOX1-GFP-positive dots in five fluorescence images were examined. Data represent average values ± sd (error bars).

