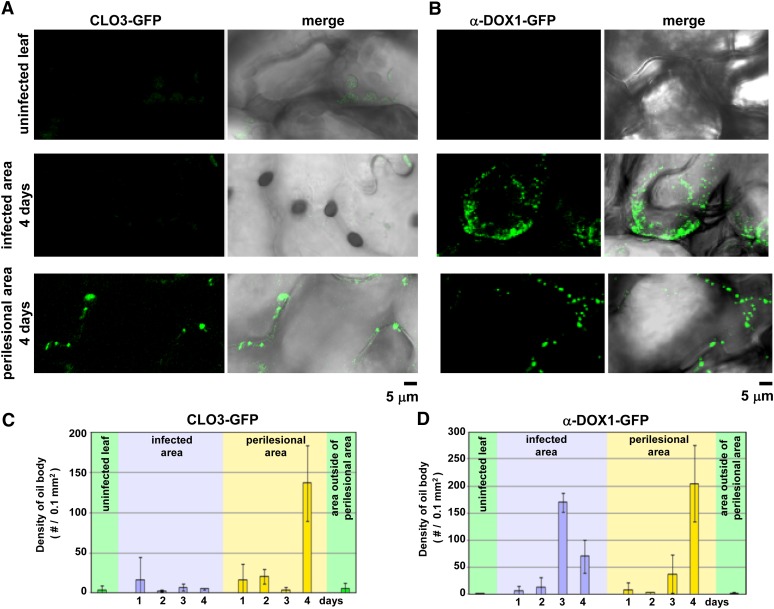
Figure 4.
Changes in the number of CLO3-GFP-positive and α-DOX1-GFP-positive oil bodies in the infected area and the yellow perilesional area. A, Punctate fluorescent structures in the leaves of pCLO3::CLO3-GFP transgenic plants 0, 2, and 4 d after infection with C. higginsianum. Uninfected leaves, the infected area, and the perilesional area were observed by confocal laser scanning microscopy (CLO3-GFP) and differential interference contrast (DIC). Right panels show merged images of CLO3-GFP and DIC. B, Punctate fluorescent structures in the leaves of pα-DOX1::α-DOX1-GFP transgenic plants 0, 2, and 4 d after infection with C. higginsianum. Uninfected leaves, the infected area, and the perilesional area were observed by confocal laser scanning microscopy (α-DOX1-GFP) and DIC. Right panels show merged images of α-DOX1-GFP and DIC. C and D, Changes in the density of CLO3-GFP-positive (C) and α-DOX1-positive (D) oil bodies (number of oil bodies per 0.1 mm2 of tissue) in the respective leaf area of the transgenic plants after infection. Vertical bars indicate sd of three individual leaves.

