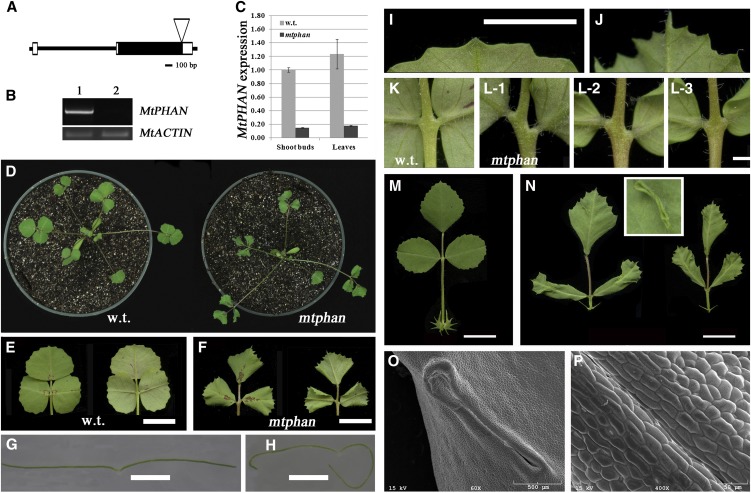
Figure 1.
Compound leaf phenotypes of the mtphan mutant. A, MtPHAN gene structure and Tnt1 insertion site. Black boxes, Exons; white boxes, 5′ and 3′ untranslated regions; horizontal lines, introns. B, RT-PCR analysis of MtPHAN gene expression in 21-d-old shoot buds. Lane 1, The wild type (R108); lane 2, mtphan. An MtACTIN gene was used as a loading control. PCR cycles used were 32 and 28 for MtPHAN and MtACTIN, respectively. C, Quantitative RT-PCR analysis of MtPHAN gene expression in 21-d-old plants. MtACTIN was used as the reference gene. D, Images of 21-d-old wild type (w.t.; left) and mtphan mutant (right) plants. E and F, Closeup views of adaxial (left) and abaxial (right) sides of wild-type (E) and mtphan (F) compound leaves. G and H, Cross sections of leaflets of the wild type (G) and the mtphan mutant (H). I and J, Closeup views of distal leaf margins of the wild type (I) and the mtphan mutant (J). K and L, Closeup views of the typical symmetric lateral leaflet placement in the wild type (K) and various lateral leaflet placements in the mtphan mutant (L-1 to L-3). M and N, Compound leaves of 70-d-old wild-type (M) and mtphan (N) plants. The inset shows ectopic tissues developed on the adaxial leaf surface of the mutant. O and P, SEM images show ectopic tissues and epidermal cell morphologies on the adaxial leaf surface of the mtphan mutant. Bars = 1 cm (E, F, M, and N), 2 mm (G, H, K, and L), and 5 mm (I and J).

