Figure 1.
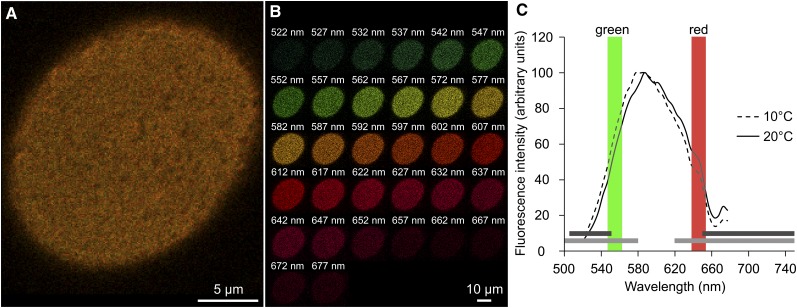
Characterization of the red/green ratio of a single-cell PM labeled with di-4-ANEPPDHQ by multispectral confocal microscopy. A, Observation of maximum surface area of di-4-ANEPPDHQ-labeled tobacco BY2 suspension cells (excitation at 488 nm; emission corresponds to the sum of fluorescence intensities acquired from all channels, ranging from 520 to 680 nm) with a color rendering of pixel fluorescence. B, Separate images for each wavelength corresponding to the emission fluorescence of a single channel captured by a 5-nm band pass (central value is reported). C, Representative emission spectra of di-4-ANEPPDHQ in tobacco cell PM exposed for 5 min at different temperatures (n = 10 independent cells for each condition). Depending on the device available, previous studies have used different band passes centered around 550 and 660 nm to quantify the blue shift of the dye on living material. For example, the horizontal, light gray bands correspond to 500 to 580 nm and 620 to 750 nm (Miguel et al., 2011), while the horizontal, dark gray bands correspond to 505 to 550 nm and a long pass higher than 650 nm (Liu et al., 2009). The colored, vertical band pass bars correspond to the values used in our experimental setup to calculate an accurate red/green ratio (545–565 nm in red and 635–655 nm in green).

