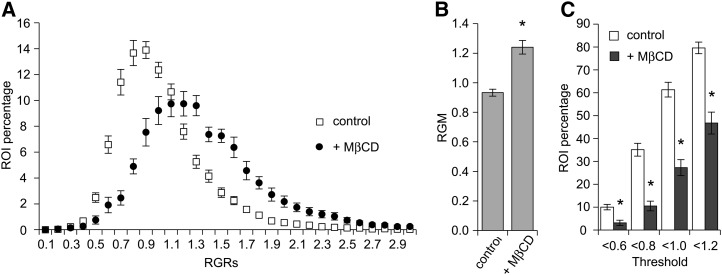
Figure 5.
Heterogeneity of the order level of tobacco cell PM is sterol sensitive. A, Distribution of red/green ratio values of individual ROIs (288 nm × 288 nm) of the PM and influence of sterol depletion (+MβCD). The x axis corresponds to the class of RGR values, and only the maximal value of each class is reported on the graph. The y axis corresponds to the ROI percentage of each class. B, Influence of sterol depletion (+MβCD) on RGM. C, Representativeness of low RGR values according to PM sterol content. ROIs exhibiting an RGR below the threshold values indicated on the x axis were counted, and their percentage was reported along the y axis for control (white) and treated (black) cells. For both B and C, asterisks indicate a significant difference (P value < 0.01), and data are means ± se of the mean (n = 49 [control] and 11 [treated cells]).

