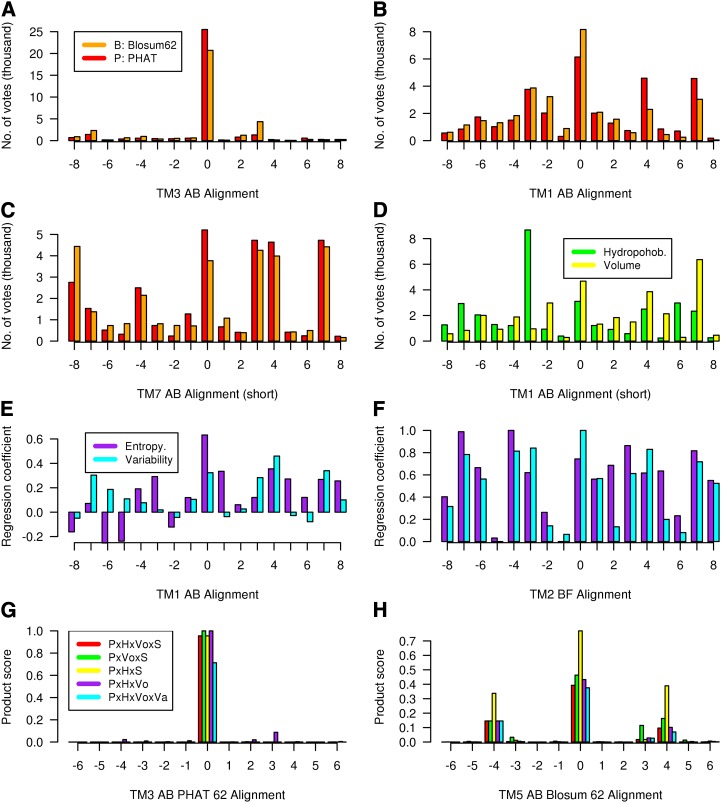
Figure 1.
Various alignment results to illustrate the method; each legend is valid until replaced by an alternative. A to C, Number of votes for each of the 17 alternative class A-class B pairwise alignments evaluated using the PHAT matrix (P, red, left) and the Blosum62 matrix (B, orange, right): TM3 (A), TM1 (B), and TM7 (C). D, Number of votes for the TM1 class A-class B pairwise alignments evaluated using hydrophobicity (H, green, left) and volume matrix (Vo, yellow, right). E, Maximum lagged correlation values for each alignment evaluated using entropy (S, purple, left) and variability (Va, cyan, right) for the class A-class B TM1 alignment. F, Correlation values of E scaled between 0 and 1.0 for the class B-class F TM2 alignment. G, Product scores for each of the TM3 class A-class B alignments. The product scores are as follows (left to right): P × H × Vo × S (red), P × Vo × S (green), P × H × S (yellow), P × H × Vo (white), and P × H × Vo × Va (purple). H, The product scores for each of the TM5 class A-class B alignments. The product scores are as follows: B × H × Vo × S (orange), B × Vo × S (green), B × H × S (yellow), B × H × Vo (white), and B × H × Vo × Va (purple). [See online article for color version of this figure.]

