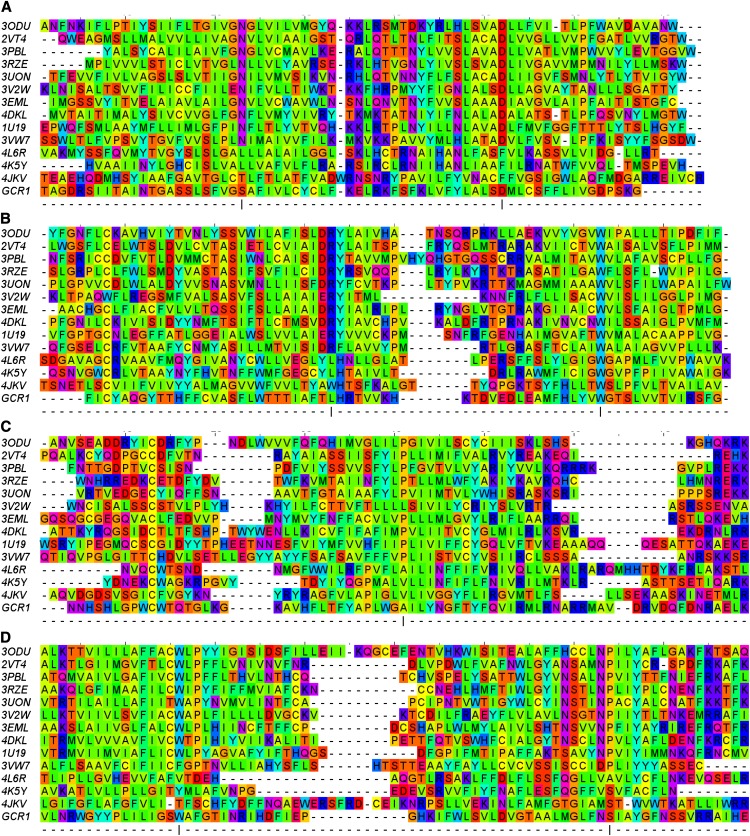
Figure 2.
Sequence alignment between GCR1 and the class A, class B, and class F template sequences; the color reflects the biophysical properties. The most conserved positions within each helix in class A are marked by a vertical bar and correspond to position 50. The residues are color coded according to their properties as follows: blue, positive; red, negative or small polar; purple, polar; cyan, polar aromatic; green, large hydrophobic; yellow, small hydrophobic. This corresponds to the Taylor scheme, as implemented in Jalview (Clamp et al., 2004). For clarity, some ungapped sequence sections have been truncated.

