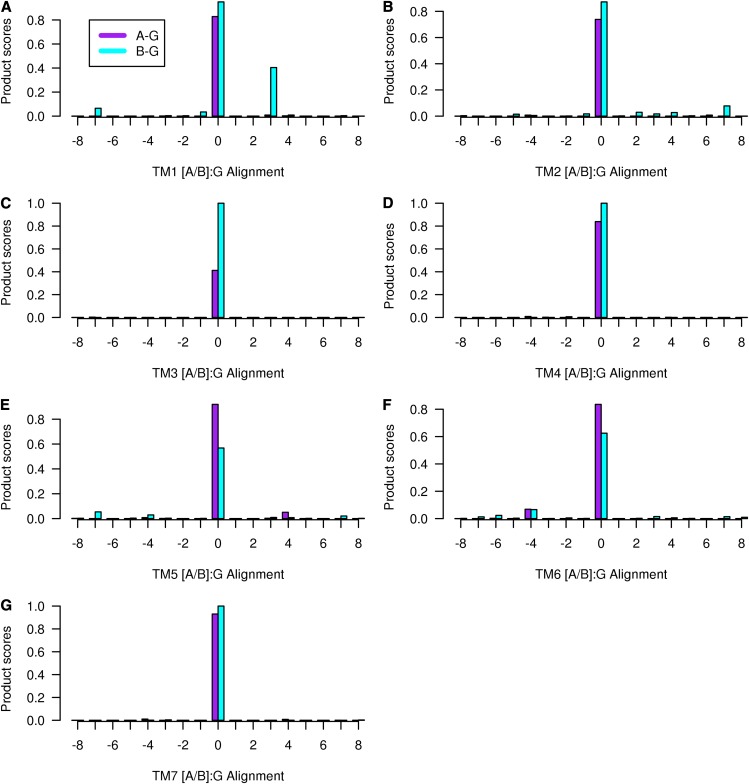
Figure 3.
The product of the four scaled scores (PHAT matrix score × hydrophobicity × volume × entropy) for the alignment between class A GCR1 homologs (left, purple) and class B GCR1 homologs (right, cyan). The alignment corresponding to the 0 alignment is given in Figure 2. The legend given for TM1 is valid for all plots. [See online article for color version of this figure.]

