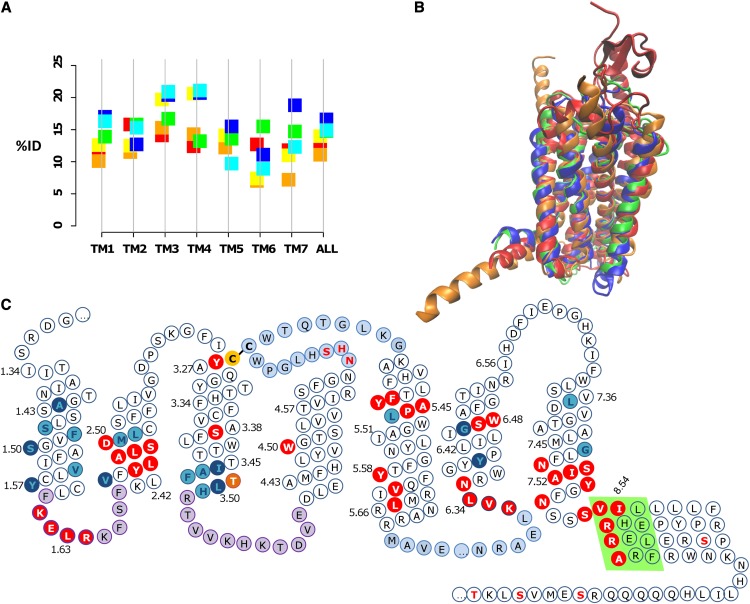
Figure 4.
A, Mean percentage identity (%ID) between different GPCR families. The class A-class B, class A-class F, and class B-class F percentage identities are shown to the left of the vertical line in red, orange, and yellow, respectively; the percentage identities between class A, class B, and class F with the GCR1 homologs are shown to the right in green, blue, and cyan, respectively. The percentage identities for TM3 between GCR1 homologs and class C and class D GPCRs are 14.3% and 11.9%, respectively. B, Structural alignment (determined by modeler using all residues) between the inactive GCR1 (green), the class A dopamine D3 (blue), the class B glucagon (orange), and the class F smoothened (red) receptors looking toward TM1 to TM4. The root mean square deviation (RMSD) between minimized inactive GCR1 and the dopamine, glucagon, and smoothened receptors is 1.29, 2.07, and 3.33 Å, respectively. For comparison, the expected RMSDs between the α, β, χ, and δ class A GPCRs are 2.2 to 3.0 Å and that between class A and class B GPCRs is typically 2.7 to 3.3 Å (Hollenstein et al., 2013; Siu et al., 2013), so these RMSDs are of the expected magnitude. The RMSDs were calculated over the helical domain over the ranges 1.36 to 1.59, 2.40 to 2.58, 3.25 to 3.51, 4.45 to 4.62, 5.43 to 5.65, 6.33 to 6.43, and 7.43 to 7.53; shorter sections were used for TM6 and TM7 because of the known outward tilt in class B in this region. C, Snake diagram showing GCR1 features that characterize the GPCR fold. The Cys residues of the TM3-ECL2 disulfide bond are shown in yellow with black lettering. Motifs shared with class A and/or class B GPCRs are shown in red with white lettering. Group-conserved residues that have the same character in class A, class B, and GCR1 homologs are shown in cyan with dark blue lettering; other common group-conserved positions are shown in dark blue with cyan lettering. The TLH positional equivalent of the DRY motif is shown in orange (residues are only shown in one category). ICL1 and ICL2 are denoted in purple, as they are the same length as their class A and/or class B counterparts. ECL2 and ICL3 are shown in light blue, as they are the longest ECL and ICL, respectively. The ampipathic helix 8 is denoted by a light green background. Potential phosphorylation sites C terminal of the ampipathic helix are denoted by red lettering. The potential glycosylation site in ECL2 is also denoted by red lettering.

