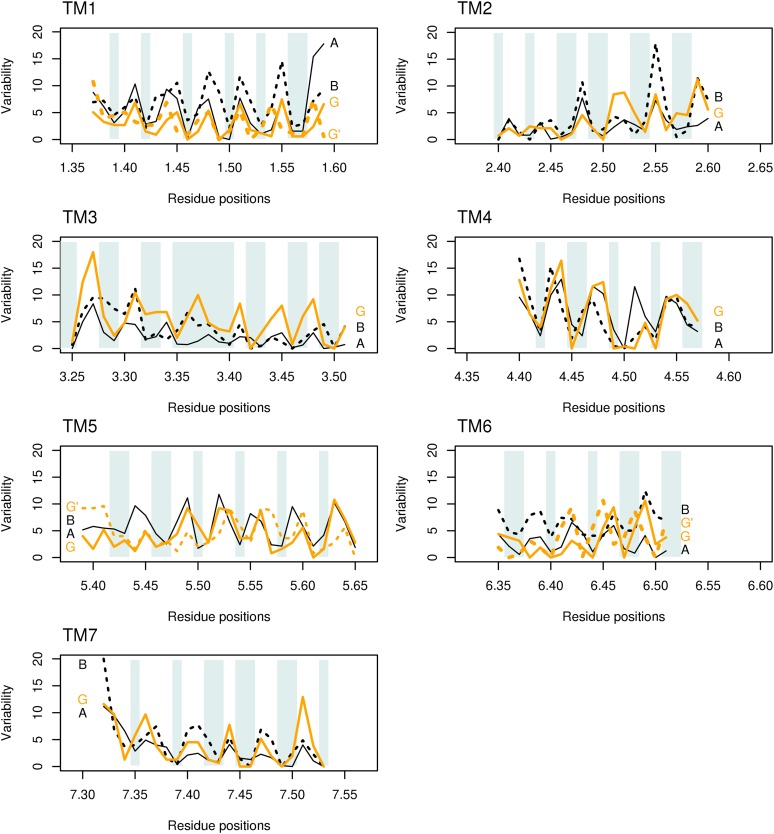
Figure 5.
Variability for each of the seven transmembrane helices. The variability for class A GPCRs (A, solid lines) and class B GPCRs (B, dotted lines) is shown in black; the variability for GCR1 homologs is shown in orange (G). Shading indicates the internal or buried positions (which should have low variability). For TM1, TM5, and TM6, the variability for the alternative +3, +4, and −6 GCR1 alignments (G′) is shown with orange dashes. Position 7.34 is a restricted external position in many receptors, hence its low variability. The different helix lengths shown reflect both the natural helix length and the length over which a common conformation can be expected (Vohra et al., 2013). Although positions 3.35 to 3.40 in TM3 are nominally internal, they still show a maximum variability in line with the helix periodicity. [See online article for color version of this figure.]

