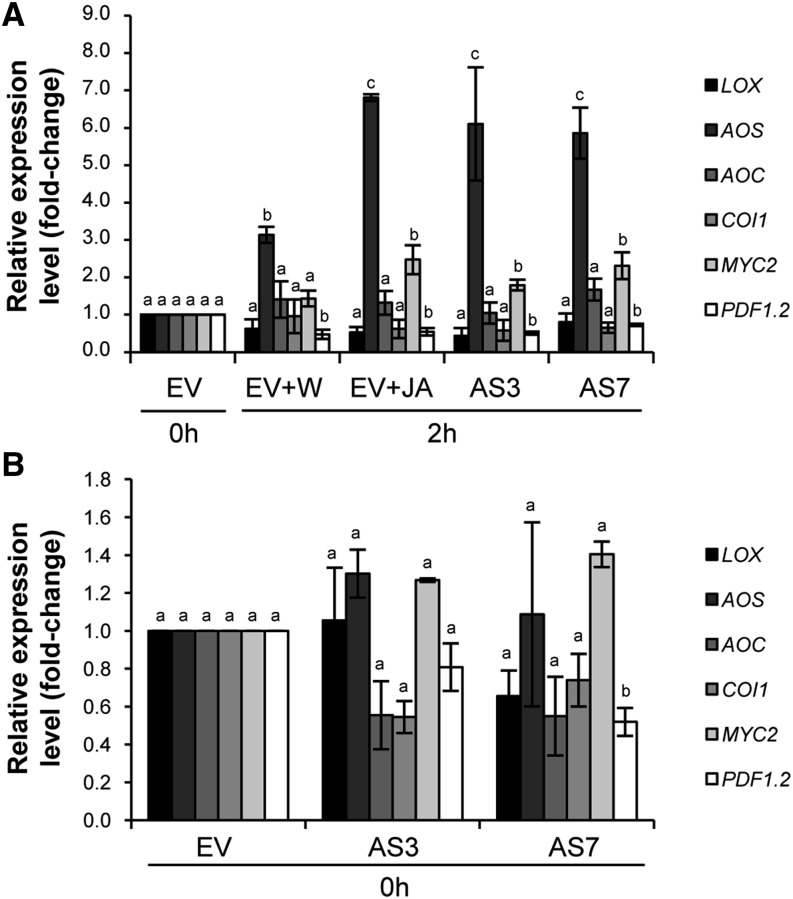
Figure 8.
Quantitative real-time PCR analyses of genes involved in JA biosynthesis (sweet orange homologs of LOX, AOS, and AOC) and signaling (sweet orange homologs of COI1, MYC2, and PDF1.2). The differential expression of JA biosynthetic/signaling genes in EV control and AS fruits after (A) and before (B) P. digitatum inoculation is shown. EV fruits were treated either with water (EV+W) or JA (EV+JA) before challenge inoculation. The expression of each gene was analyzed using four different 96-well plates (with at least three technical replicates for each one). Data represent means ± se and are derived from at least three fruits per plant. Fold change was calculated in relation to two independent EV control lines before inoculation, to which an arbitrary value of 1 was assigned. Different letters indicate significant differences in the expression of each gene at P < 0.05 using Fisher’s protected lsd test. AS3 and AS7 refer to two independent d-limonene synthase AS transgenic lines.

