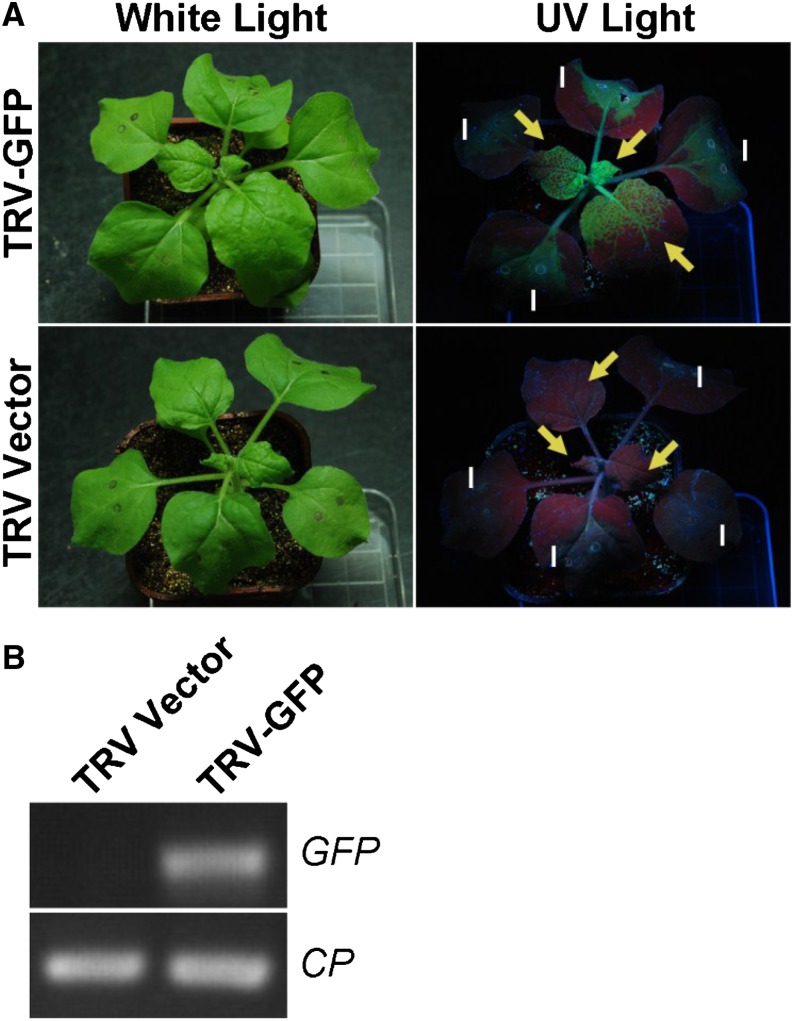
Figure 2.
Visualization of GFP expressed by the modified TRV vector in N. benthamiana. A, The TRV-GFP-infiltrated plants were photographed at 4 d post inoculation under white light (left) or UV illumination (right). Arrows indicate the upper uninfiltrated leaves, and “I” indicates the infiltrated leaves. Green color under UV light indicates the GFP signal. B, RT-PCR detection of TRV RNA in upper uninfiltrated leaves. RNA samples were extracted from TRV-GFP and TRV control plants, and RT-PCR was performed with GFP- and TRV CP- specific primers. [See online article for color version of this figure.]

