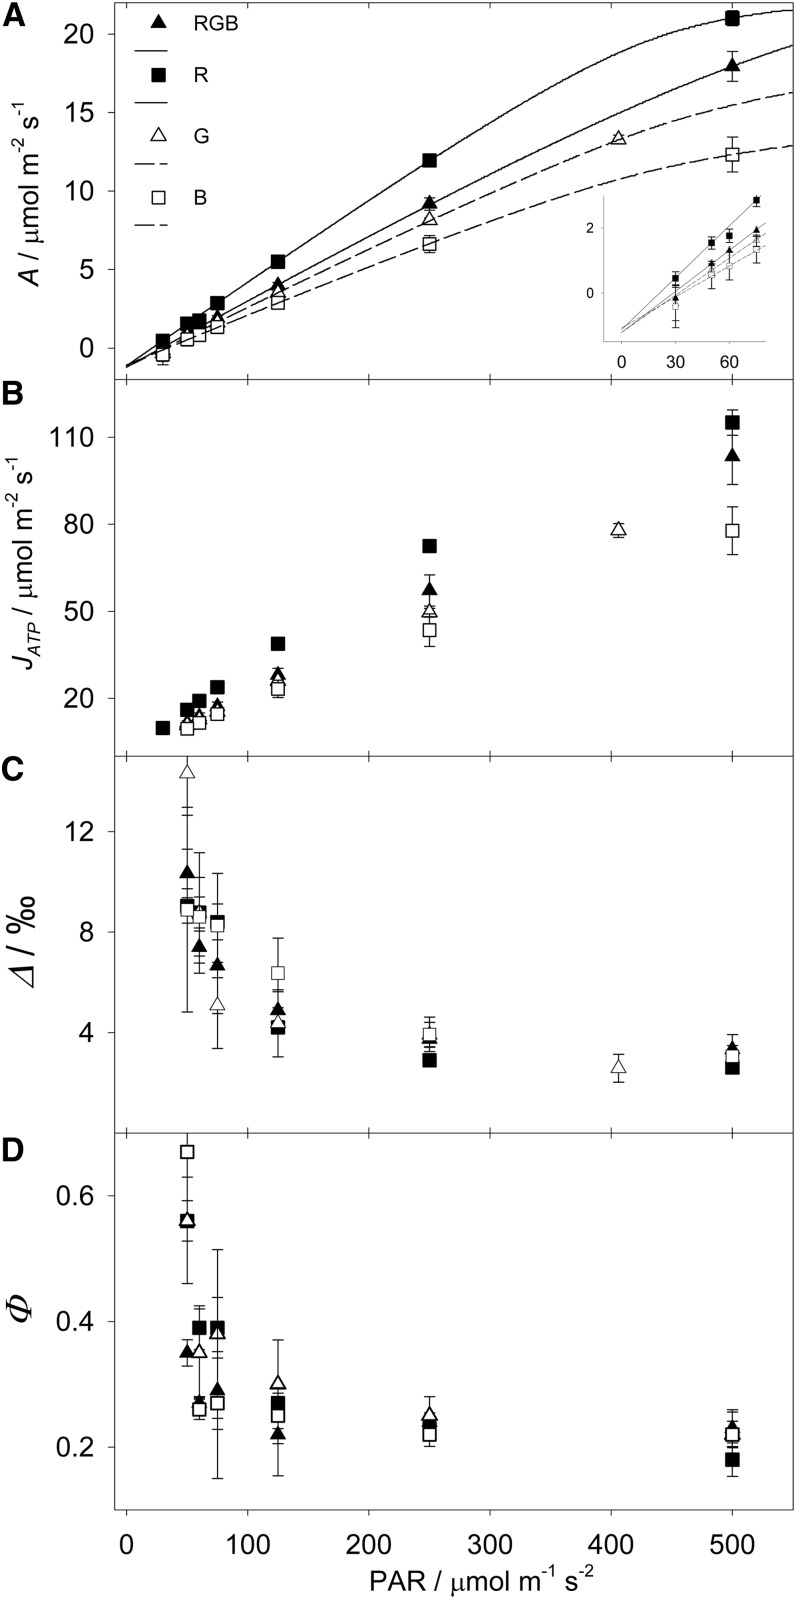
Figure 3.
Maize responses to decreasing light intensity under different light qualities. A, Net A. The curves were fitted in order to calculate the light compensation point (Table IV). The inset shows a magnification. B, JATP, measured with the low oxygen-ETR method. C, Online Δ during photosynthesis. D, Φ resolved from Δ. Error bars represent se; n = 4. B, Blue light; G, green light; R, red light.

