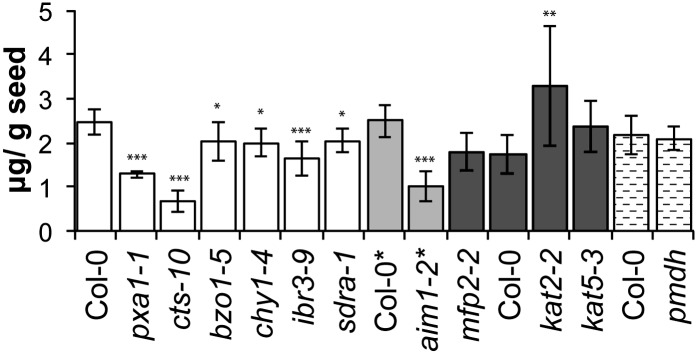
Figure 3.

Analysis of SA content in seeds of β-oxidation mutants. Values are μg g−1 seed and the average of seeds collected from eight individual parent plants for each genotype. Error bars represent sd (*P < 0.05, **P < 0.01, ***P < 0.001, ANOVA). Plants were grown under long-day conditions, except those marked with asterisks after their name, which were grown in short days. The different shading identifies analyses of mutants and wild types that were grown in separate batches and processed in separate analytical runs.
