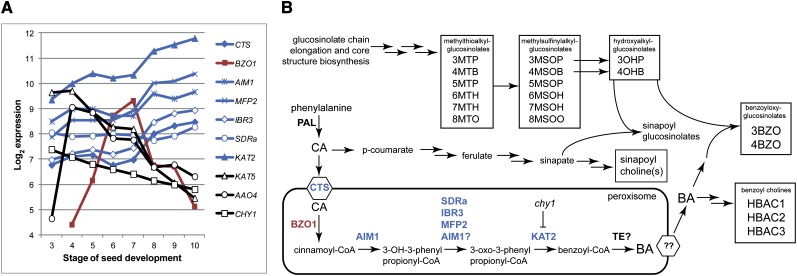
Figure 4.
A, Expression of key genes of BA biosynthesis during seed development. Absolute expression values were obtained from the Electronic Fluorescent Pictograph browser (http://bar.utoronto.ca/efp_arabidopsis/cgi-bin/efpWeb.cgi) and log2 transformed. Coexpressed β-oxidation genes are shown in blue; other β-oxidation genes and AAO4 are in black, and BZO1 is in red. B, General model of peroxisomal BA production and its relation to BG production. Metabolites detected and quantified in this study are highlighted in boxes, and β-oxidation enzymes shown to play a role in BA biosynthesis are printed blue or red as in A. Multiple arrows between metabolites indicate multiple enzymatic steps. The scheme is modeled after Lee et al. (2012) and Sønderby et al. (2010).

