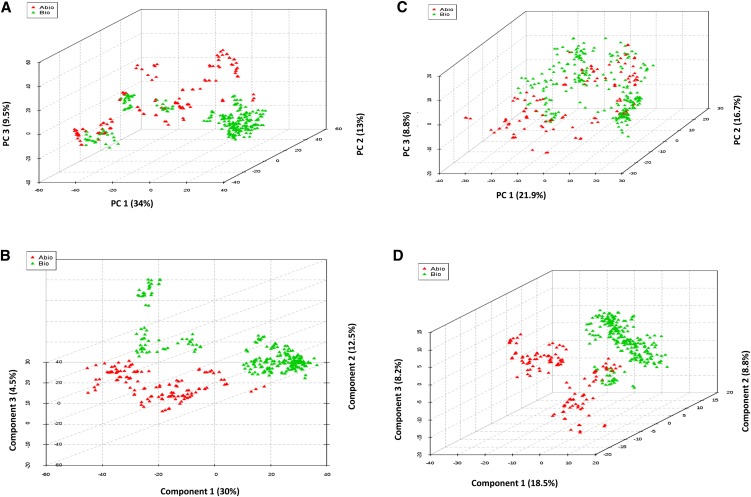
Figure 2.
3D plots of two-class classification of abiotic and biotic stresses. A and B, 3D plots based on the top three components by PCA and PLS-DA, respectively using 1,377 common DEGs. C and D, 3D plots based on the top three components by PCA and PLS-DA, respectively, using the top 540 genes ranked by SVM return 100% accuracy of classification. The axes of B are rotated 90°, which shows the best possible separation of two groups. [See online article for color version of this figure.]

