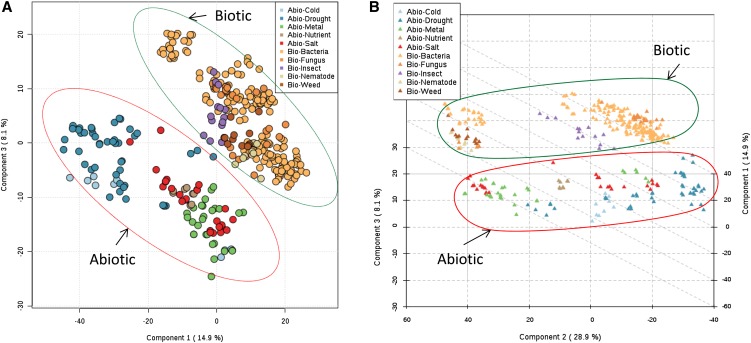
Figure 4.
Multiclass classification of 10 stress conditions by PLS-DA. All five abiotic stresses are circled by red ovals and all five biotic stresses are circled by green ovals. A, Two-dimensional plot between PLS-DA components 1 (14.9%) and 3 (8.1%). B, 3D plot between PLS-DA components 1 (14.9%), 2 (28.9%), and 3 (8.1%). [See online article for color version of this figure.]

