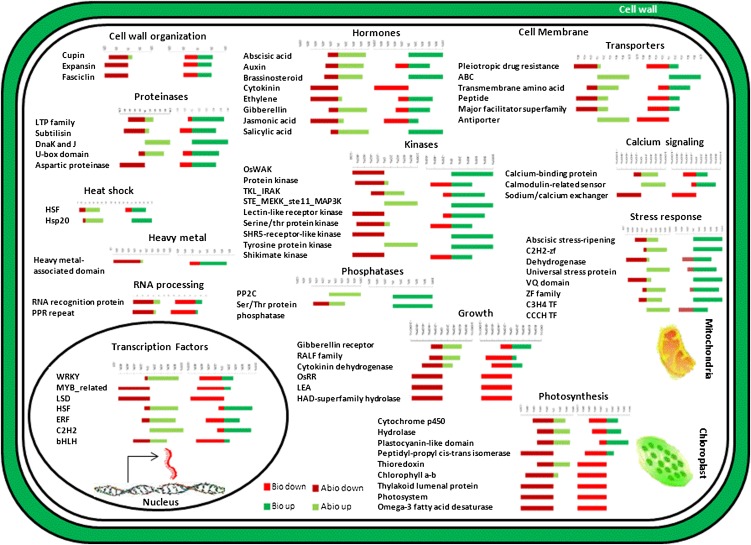
Figure 6.
Visual representation of different gene families and functional categories based on expression between abiotic and biotic stresses. For each annotation, the stacked bars represent up-regulated genes (total) scaled to 100% and down-regulated genes scaled to −100%. [See online article for color version of this figure.]

