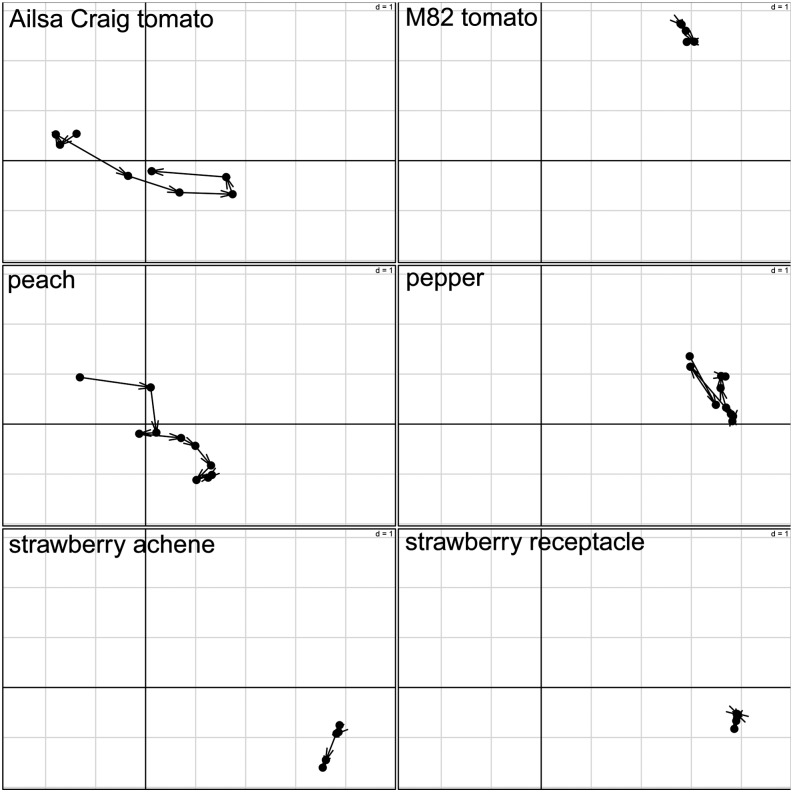
Figure 6.
Visualization of the contribution of observations (i.e. developmental and ripening stages) according to STATIS. The corresponding time stages are projected onto PC1 and PC2 for all six data tables. The position of a time point reflects the influence of the particular stage with respect to the overall metabolic adjustments of the investigated species during fruit development and ripening. Arrows between two successive stages illustrate the sequential progression of the contribution over time with the compromise space defined by PC1 and PC2. Although tomato cv M82 and peach are climacteric fruits, they exhibit different behavior with respect to the compromise, while peach and pepper exhibit similar behavior even though they belong to different categories of fruit.

