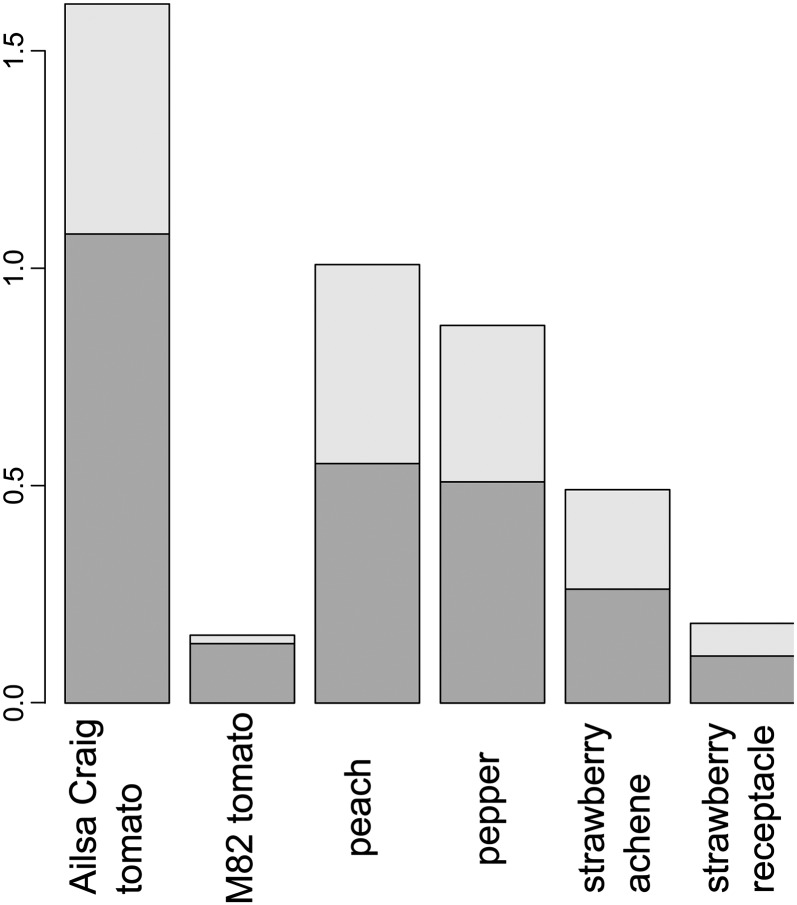
Figure 7.
Temporal progression of fruit developmental stages. A stacked bar plot illustrates the sum of distances of all consecutive time points in the compromise projection for all six data tables normalized for the number of time points available for each data set (compare with Fig. 6). Later ripening stages (indicated by stars in Fig. 1) are colored in lighter gray. Nonclimacteric fruit undergo less dramatic changes across development in comparison with climacteric fruits, with cv M82 again showing pronounced divergence from this pattern.

