Figure 4.
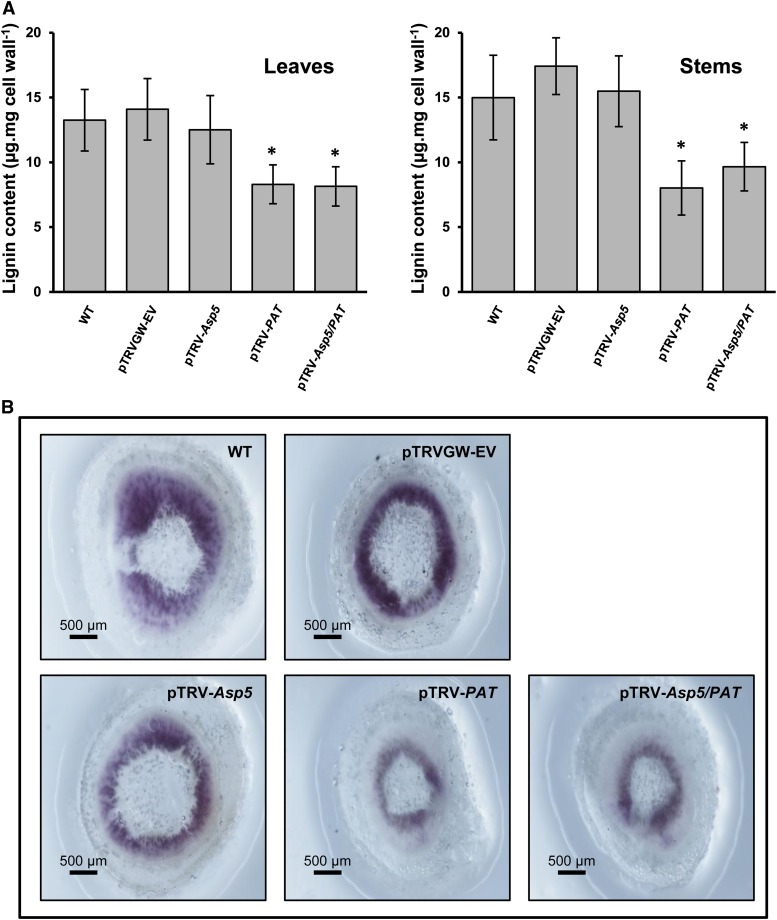
Lignin content and histological lignin staining in N. benthamiana plants. A, Quantification of lignin in leaves (left) and stems (right) from N. benthamiana plants. WT, Wild type; pTRVGW-EV, control vector; pTRV-Asp5, silenced NbAsp5; pTRV-PAT, silenced NbPAT; pTRV-Asp5/PAT, cosilenced NbAsp5/NbPAT. Six independent biological replicates were measured. Average values and sd were calculated. Error bars represent se, and asterisks indicate significant differences compared with control plants. B, Histological detection of lignin in fresh-cut stem sections of N. benthamiana corresponding to control and silenced plants. Red-violet color shows the reaction of phloroglucinol-HCl with cinnamaldehyde end groups of lignin. [See online article for color version of this figure.]

