
Table 4.
Comparison of lead excretion via urine between experimental groups
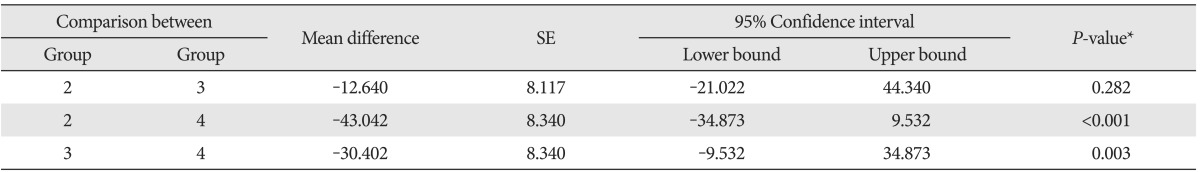
Group 1, control group (normal); group 2, lead only group; group 3, lead with low dose vitamin C group; group 4, lead with high dose vitamin C group. *By repeated measure of ANOVA and post-hoc analysis using Tukey method.