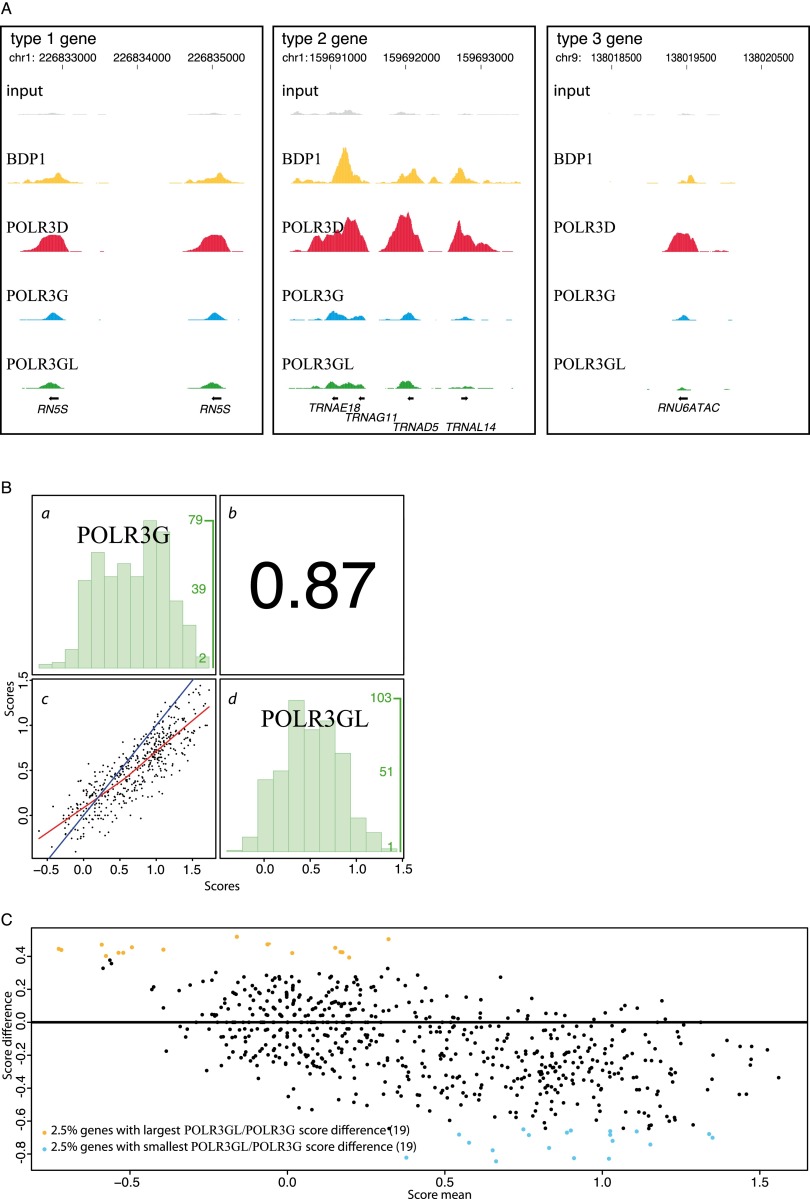
Figure 2.
POLR3G and POLR3GL occupy largely the same loci in human IMR90 cells. (A) POLR3G and POLR3GL occupy all three types of Pol III promoters. UCSC Browser view of type 1 (RN5S), type 2 (TRNA), and type 3 (RNU6ATAC) Pol III genes showing occupancy by BDP1, POLR3D, POLR3G, and POLR3GL, as well as the input. The x-axis shows the genomic location; the y-axis shows sequence tag accumulation. The scales on the y-axes are similar for all factors. (B) Spearman's rank correlation of the POLR3G versus POLR3GL scores. (c) x-axis, POLR3G scores; y-axis, POLR3GL scores; in blue the x = y line; in red, the regression line. (b) Correlation coefficient. (a) Distribution histogram representing, for each POLR3G score interval of 0.2 (see x-axis scale at the bottom of c), the number of genes in that interval (y-axis at the right of the panel: The numbers in green correspond to the lowest, middle, and highest number of genes). (d) As in a, but for each POLR3GL score interval of 0.2. (C) MvA plot with the score means [(POLR3GL score + POLR3G score)/2] on the x-axis and the score difference (POLR3GL score − POLR3G score) on the y-axis. All scores are in log2 (see Supplemental Table S2).

