Figure 5.
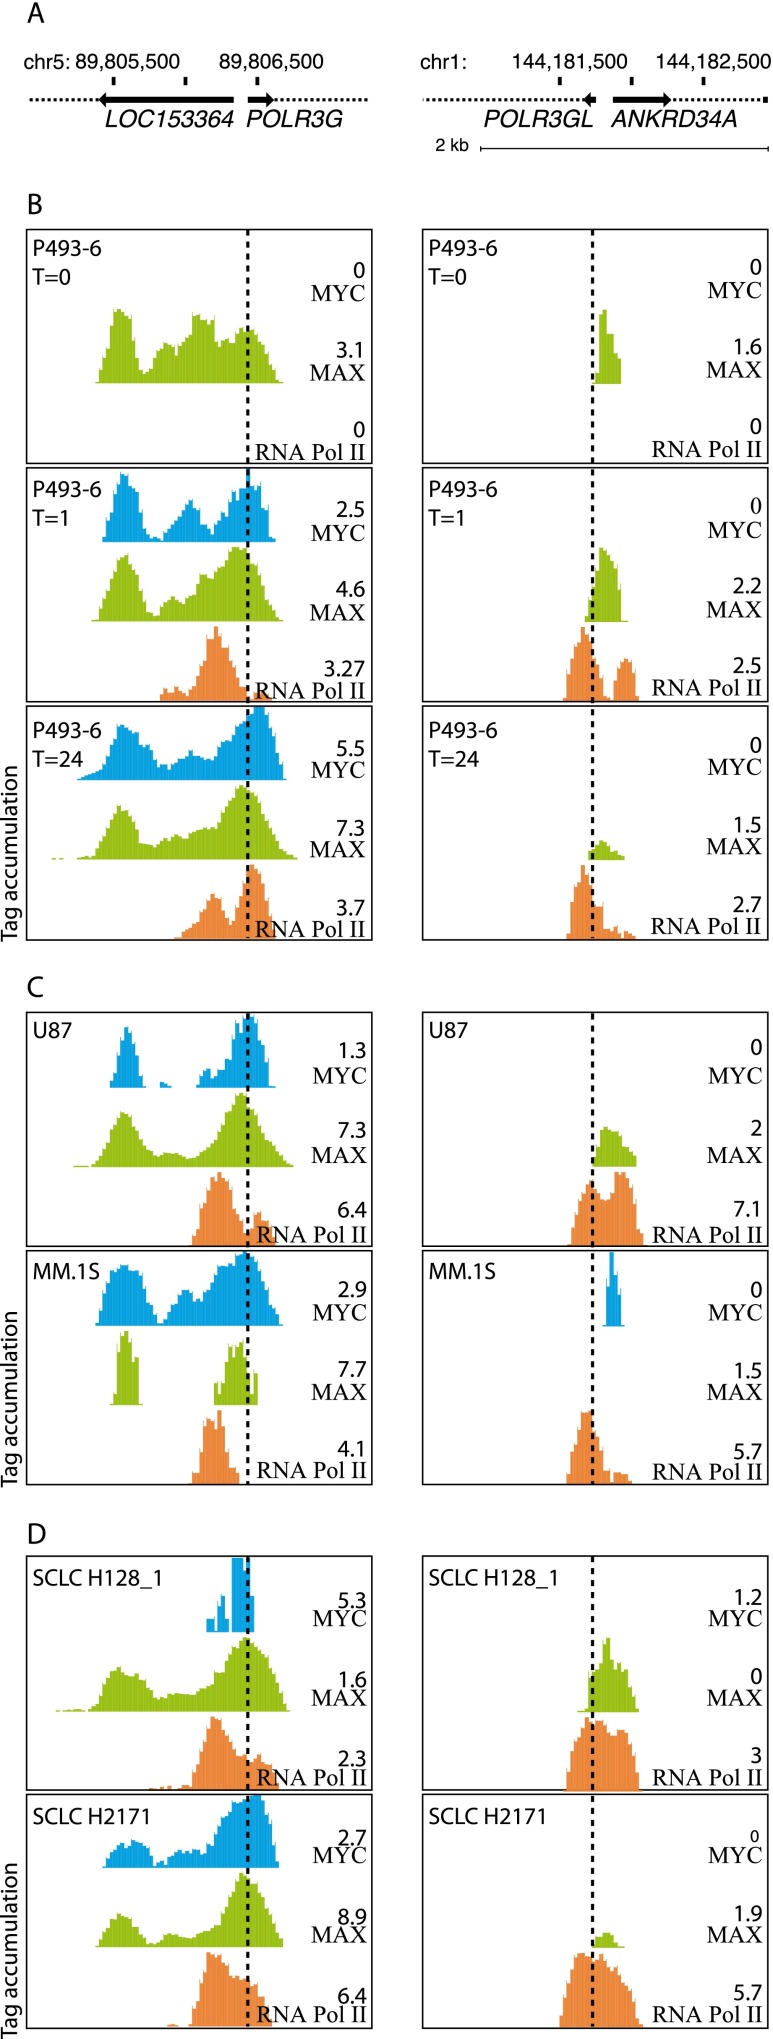
MYC binds to POLR3G but not to POLR3GL TSS. (A) Schematic of the POLR3G and POLR3GL genomic regions. (B) UCSC Browser views showing MYC, MAX, and Pol II (antibody directed against the N-terminus of POLR2A, Santa Cruz sc-899) tag accumulation, as indicated on the right, on the POLR3G and POLR3GL promoter regions, in P493-6 cells at time 0, 1 h, and 24 h after induction of MYC, as indicated on the left. The scales on the y-axes were adjusted to the maximum height of the peaks in each track, which is indicated on the right of each track, just above the track identity. (Based on the data of Lin et al. [2012]). (C) As in B but in U87 and MM.1S cells. (D) As in A but in SCLC H128_1 and SCLC H2171 cells.

