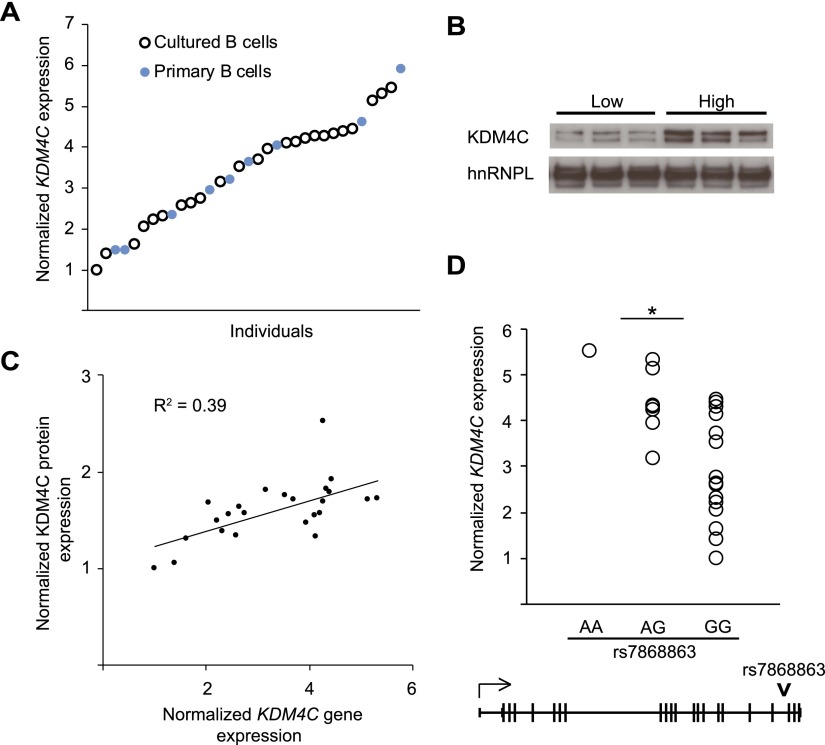
Figure 2.
Cis-regulation of KDM4C. (A) KDM4C expression levels in cultured B cells of 24 unrelated individuals (open circles) and primary B cells of nine unrelated individuals (filled circles) are shown relative to the individual with the lowest expression, as measured by qRT-PCR. (B) Western blot analysis of KDM4C protein expression with cultured B cells from three individuals with the lowest and three individuals with the highest KDM4C gene expression (n = 3). (C) Scatter plot of KDM4C gene and protein expression in the cultured B cells from 24 individuals in A; significant correlation in transcript and protein expression was found (R2 = 0.39, P < 0.05). (D) KDM4C expression in B cells is shown by their genotype at SNP rs7868863 (P = 0.006, allelic association). The SNP position is indicated.

