Figure 6.
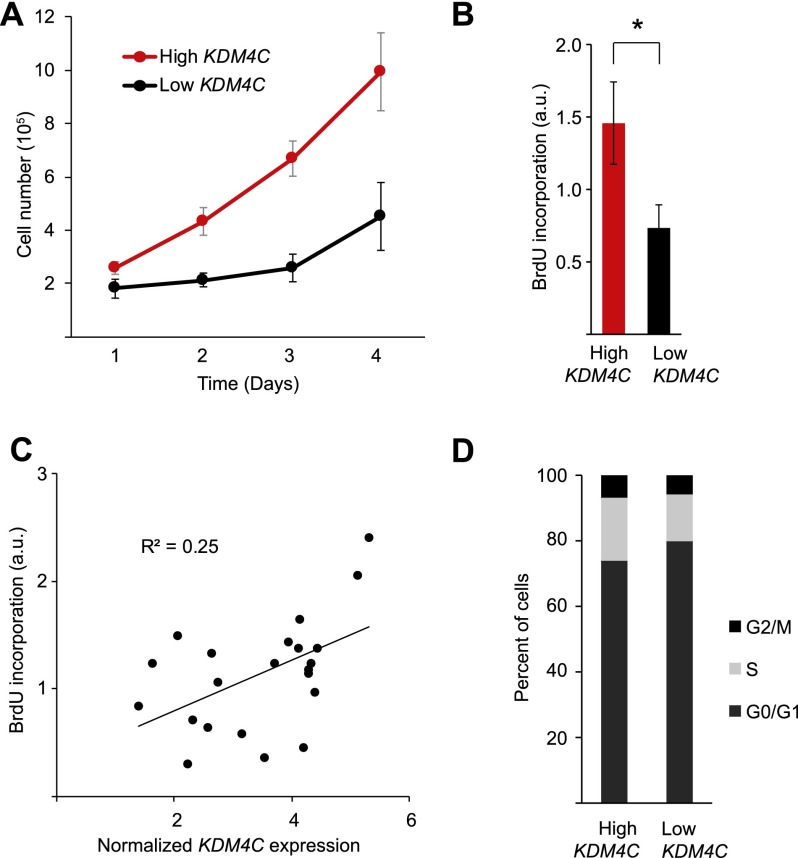
KDM4C expression is associated with cell growth in B cells. (A) Growth curve of B cells from five individuals with high or low KDM4C expression (P = 3 × 10⁻⁶, ANOVA). (B) BrdU incorporation in B cells from six individuals with high or low KDM4C expression, measured in triplicate ([*] P < 0.05, t-test). (C) BrdU incorporation is regressed on KDM4C expression level in B cells from 22 individuals, measured in triplicate. Error bars, SEM. (D) Proportion of cells at different stages of the cell cycle in individuals with high or low KDM4C expression. Error bars, SEM.

