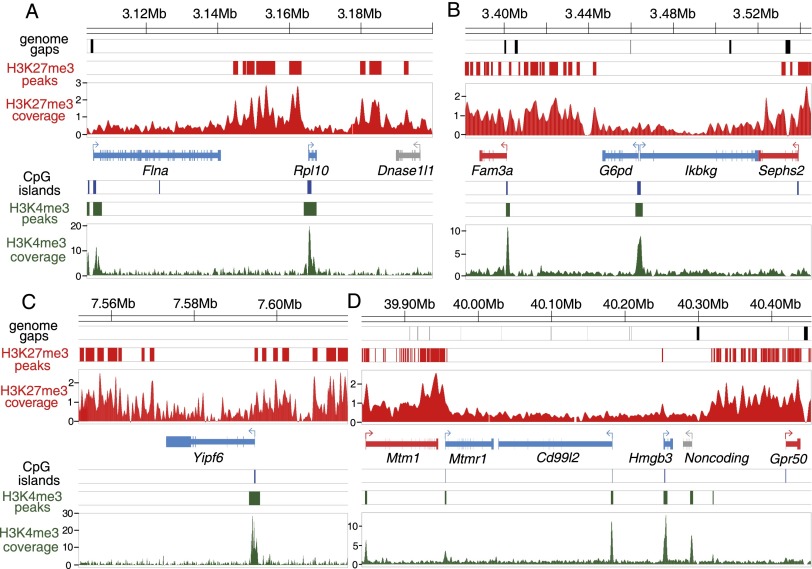
Figure 4.
Depletion of H3K27me3 marks at opossum XCI escaper genes. (A–D) H3K4me3 and H3K27me3 histone modification profiles at four X-chromosomal regions in female fetal brain samples from ChIP-seq experiments. The top three diagrams in each panel indicate the locations of genome assembly gaps (black bars), significant H3K27me3 peaks (red bars), and H3K27me3 coverage (red scans), respectively. Gene models are shown in the middle panel, color-coded according to pXCI status: (blue) escaper; (red) non-escaper; (gray) unknown due to lack of informative SNPs. The bottom three diagrams of each panel show CpG island locations (blue bars), significant H3K4me3 peaks (green bars), and H3K4me3 coverage profile (green scans). Numbers on y-axes indicate per base read depth using the spline smoothing method. For the escaper genes (Flna, Rpl10, G6pd, Ikbkg, Yipf6, Mtmr1, Cd99l2, and Hmgb3), the H3K4me3 mark is present at the promoter CpG island, while H3K27me3 marks are depleted across the gene body, consistent with the biallelic expression from both parental alleles. This pattern was seen for all 23 escaper genes with an H3K4me3 peak at the promoter region (Supplemental Figs. S30–S45).

