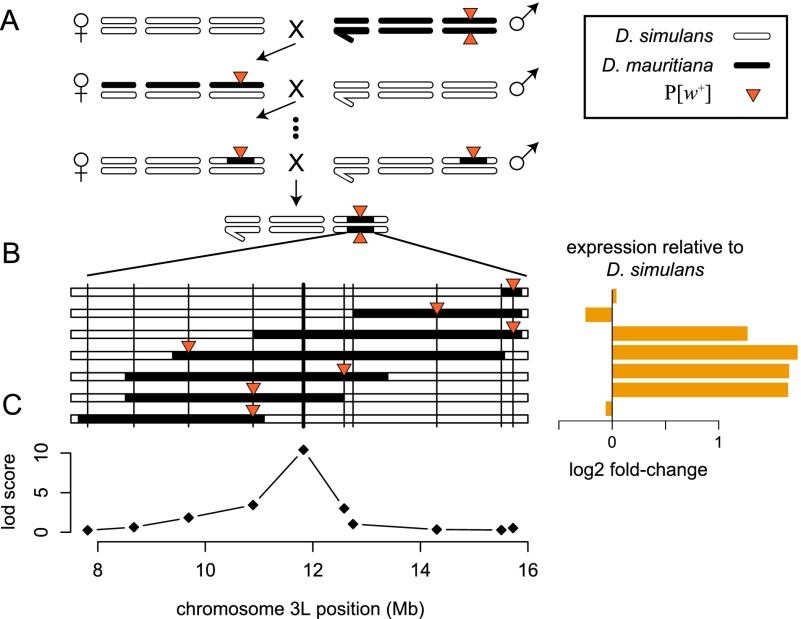
Figure 1.
Approach used to map factors within the introgressed region that affect gene expression. (A) Genomic regions marked with a visible transgene (P[w+]) were introgressed from D. mauritiana into a D. simulans background. Bars indicate the sex chromosomes (left) and the two major autosomes. (B) Gene expression was assayed in adult males and females from seven genotypes carrying overlapping introgressions on chromosome arm 3L. Horizontal black bars indicate the extent of the introgressed segments, and vertical lines denote the location of genotyping markers. Expression levels in the seven homozygous introgression lines are shown to the right for an exemplar gene (Est-6). (C) QTL mapping identified marker loci within the introgressions where the D. mauritiana allele has a detectable effect on gene expression relative to the background D. simulans strain.

