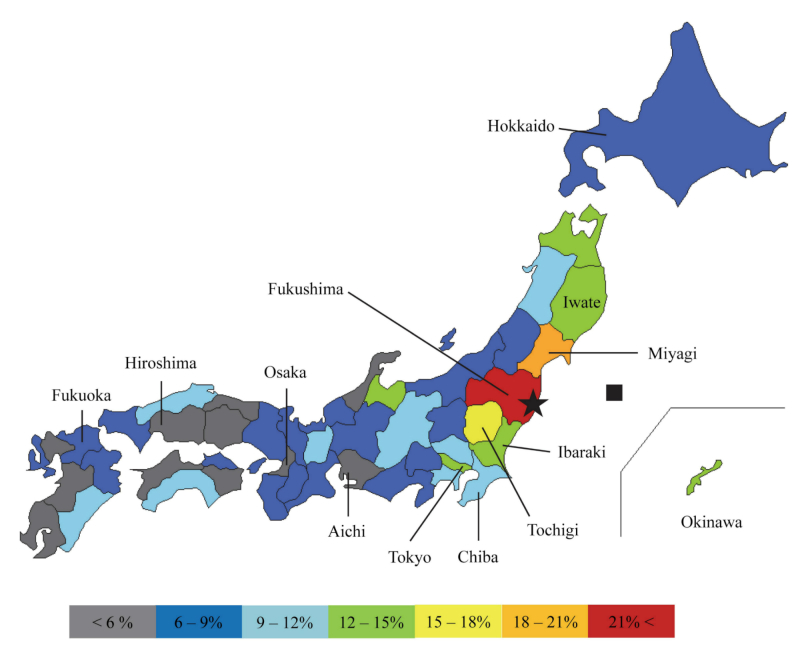
Figure 3.
Map of Japan depicting adjusted empirical Bayes estimates for percentage of people with decreased self-perceived health status. Red (>21%), orange (18%–21%), yellow (15%–18%), chartreuse green (12%–15%), aquamarine (9%–12%), blue (6%–9%), and gray (<6%). The black square indicates the epicenter of the earthquake. The black star indicates the location of the Fukushima NPP.

