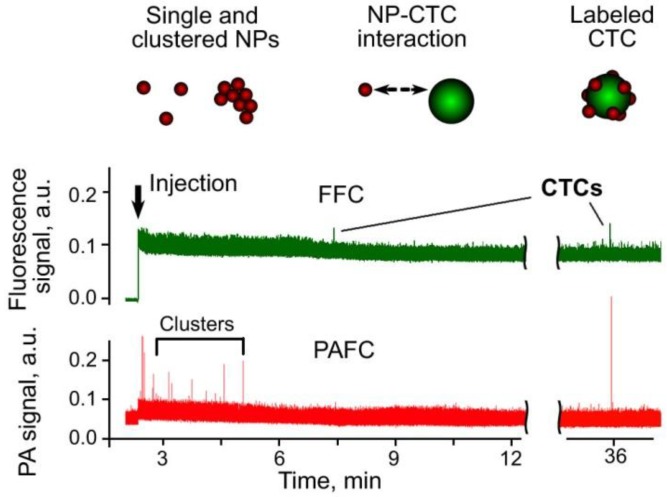
Figure 9.
In vivo multimodal PA (red trace) and fluorescence (green trace) detection of CTCs (C8161-GFP) in a tumor-bearing mouse model with functionalized MNPs and GFP as PA and fluorescent contrast agents, respectively. Black arrow marks the moment of NP injection. Wavelength and energy fluence/intensity for PAFC and FFC: 820 nm and 50 mJ/cm2 and 488 nm and 80 W/cm2, respectively.

