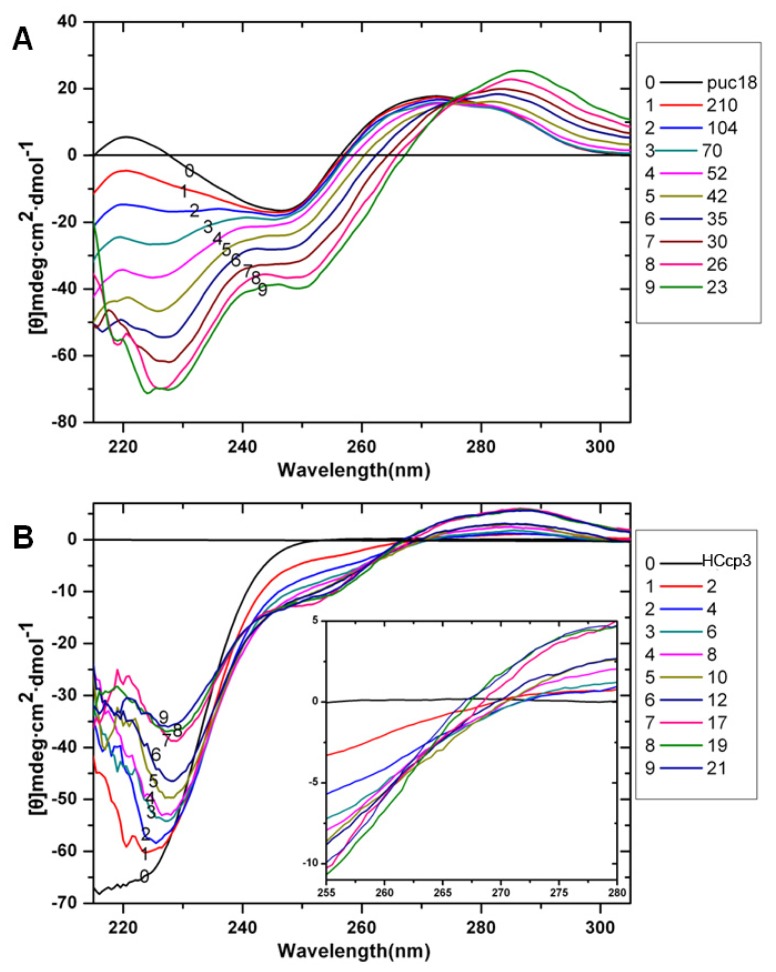
Figure 4.
Circular dichroism spectra of HCcp3 titrated with pDNA at various bp to dimer ratios. (A) 0.1 mg·mL−1 HCcp3 titrated into 50 μg·mL−1 pUC18 plasmid; (B) 100 μg·mL−1 pUC18 plasmid titrated into 0.1 mg·mL−1 HCcp3. The inset of (B) shows the enlarged region from 255 to 280 nm of (B). Data collected from 320 to 200 nm. The bp to dimer ratio of every titration is indicated in the images.

