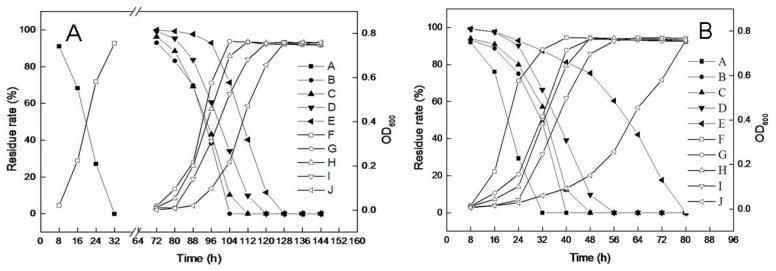
Figure 4.
Effect of NaCl concentration on biomass and DBP biodegradation by strain TJ. (A) Without NaCl induction in minimal salt medium (MSM) contains DBP; (B) With 3% NaCl induction in MSM contains DBP. A–E represent DBP residue levels at NaCl concentrations of 0%, 1%, 2%, 3%, and 4%, respectively; F–J represent strain TJ biomass at NaCl concentrations of 0%, 1%, 2%, 3%, and 4%, respectively.

