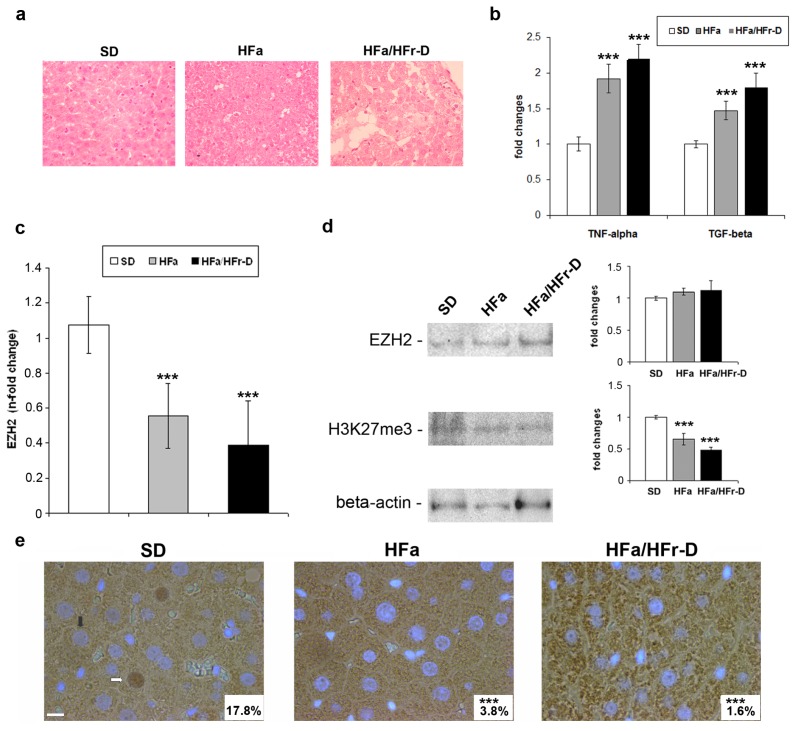
Figure 1.
(a) Hematoxylin-Eosin staining of the livers from SD, HFa and HFa/HFr-D rats (Magnification 400×); (b) Plasma protein levels of TNF-α and TGF-β in SD, HFa and HFa/HFr-D rats are reported as fold inductions. ***p < 0.001 vs. SD group; (c) EZH2 mRNA expression levels in the SD, HFa and HFa/HFr-D rats. The histograms represent the mean ± SD of at least two independent experiments in triplicate. ***p < 0.001 vs. control rats; (d) Representative western blotting of EZH2, H3K27me3 and β-actin in total liver lysates from the SD, HFa and HFa/HFr-D rats. Quantitative bars and the corresponding error bars (SD) are referred to the mean of three independent experimental determinations with respect to β-actin considered as 1. ***p < 0.001 vs. SD group; and (e) Representative immunohistochemical staining for EZH2 in the liver tissues from the SD, HFa and HFa/HFr-D rats. Nuclei are counterstained with 4′,6-diamidino-2-phenylindole (DAPI). Black and white arrows indicate the EZH2-negative and EZH2-positive nuclei, respectively. The lower, right-hand squares in white reveal the mean percentage of the EZH2-positive nuclei (Magnification 600×). ***p < 0.001 vs. control. Scale bar, 10 μm.

