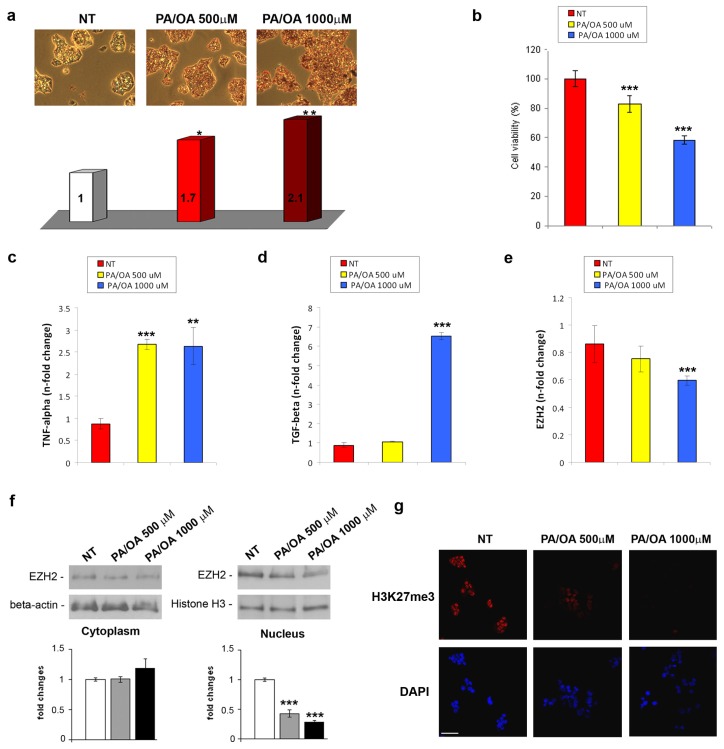
Figure 2.
(a) (upper panel) Representative photomicrographs (20×) and (lower panel) spectrophotometric quantification of lipid accumulation by Oil-Red-O in HepG2 cells either normal or treated with 500 or 1000 μM PA/OA for 24 h. Data were expressed as fold changes (at least three independent experimental determinations in quadruplicate) with respect to the control (NT). *p < 0.05, **p < 0.01 vs. the control cells; (b) Cytotoxic effect of FFAs on HepG2 cells was measured by Cell Proliferation Kit II (XTT). Data, referring to two independent tests, were normalized as % of untreated cells. ***p < 0.001 vs. control cells; TNF-α (c), TGF-β (d) and EZH2 (e) mRNA expression levels in FFA-treated or untreated HepG2 cells. The histograms represent the mean ± SD of at least two independent experiments in triplicate. **p < 0.01 and ***p < 0.001 vs. the control cells; (f) Representative western blotting and quantitative analysis of cytoplasmic and nuclear EZH2. β-actin and histone H3 were used as loading controls. Quantitative bars and the correspondent error bars (SD) are referred to the mean of at least two determinations in three independent experiments. ***p < 0.001 vs. SD; (g) (upper panel) Immunofluorescence of H3K27me3 after 24 h FFA-treatment, compared with non-treated cells (NT). (lower panel) DAPI was used to stain nuclei (Magnification 40×). Scale bar, 30 μm.

