Figure 3.
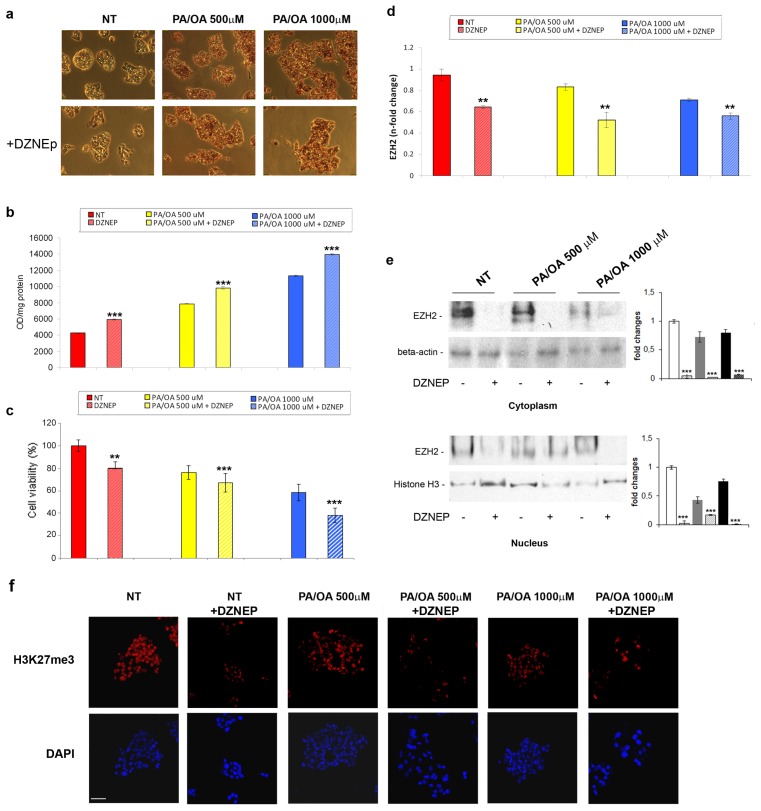
(a) Representative photomicrographs (200×) and (b) spectrophotometric quantification, expressed as optical density (OD)/mg protein of lipid accumulation by Oil-Red-O in the normal HepG2 cells or those treated with 500 or 1000 μM PA/OA for 24 h post DZNep pre-treatment. The histograms represent the mean ± SD of at least three independent experiments in triplicate. ***p < 0.001 vs. respective controls; (c) Cytotoxic effect of FFAs and/or DZNep on HepG2 cells was measured by Cell Proliferation Kit II (XTT). Data, referring to two independent tests, were normalized as % of untreated cells. **p < 0.01 and ***p < 0.001 vs. control cells; (d) EZH2 mRNA expression levels and (e) representative western blotting of the total EZH2 protein levels in the FFA-treated or untreated HepG2 cells pre-exposed to DZNep. The histograms represent the mean ± SD of at least two independent experiments in triplicate. **p < 0.01 and ***p < 0.001 vs. the respective controls; and (f) (upper panel) Immunofluorescence of H3K27me3 after previously described treatments, compared with non-treated cells (NT). (lower panel) DAPI was used to stain nuclei (Magnification 40×). Scale bar, 30 μm.

