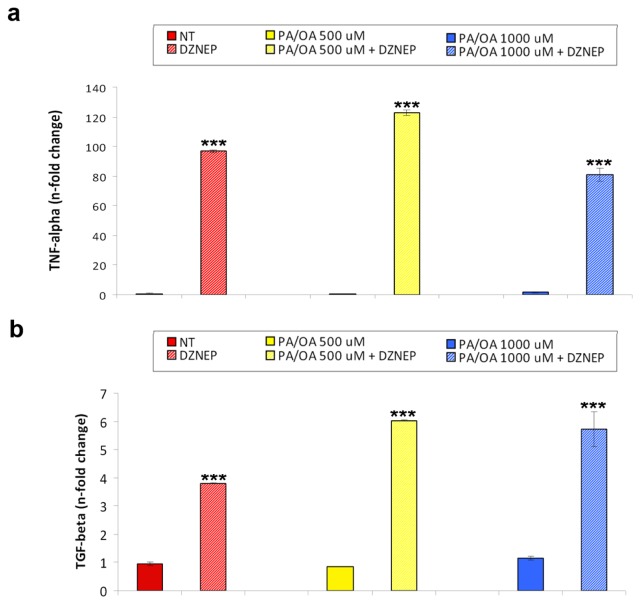
Figure 4.
(a) TNF-α and (b) TGF-β mRNA expression levels in the HepG2 cells either normal or treated with 500 or 1000 μM PA/OA for 24 h after pre-treatment with DZNep. The histograms represent the mean ± SD of at least two independent experiments in triplicate. ***p < 0.001 vs. the respective controls.

