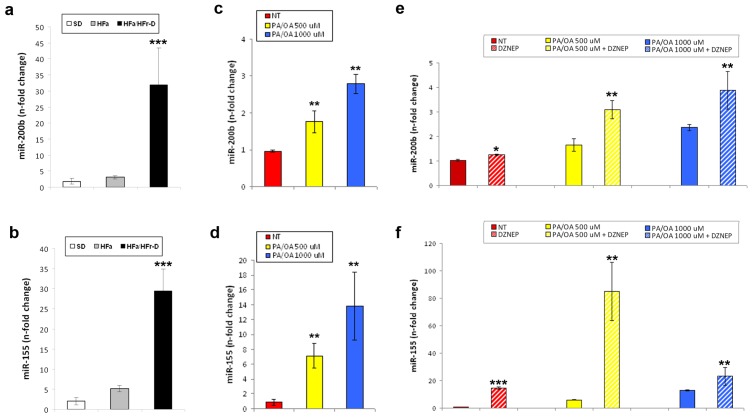
Figure 5.
miR-200b (a) and miR-155 (b) expression levels in SD and HFa/HFr-D rats. Real-Time RT-qPCR results for miR-200b (c) and miR-155 (d) in HepG2 cells normal or treated with 500 or 1000 μM PA/OA for 24 h; Expression levels of miR-200b (e) and miR-155 (f) in FFA-treated or untreated HepG2 cells pre-exposed to DZNep. Histograms represent the mean ± SD of at least two independent experiments in triplicate. *p < 0.05, **p < 0.01 and ***p < 0.001 vs. the respective controls.

