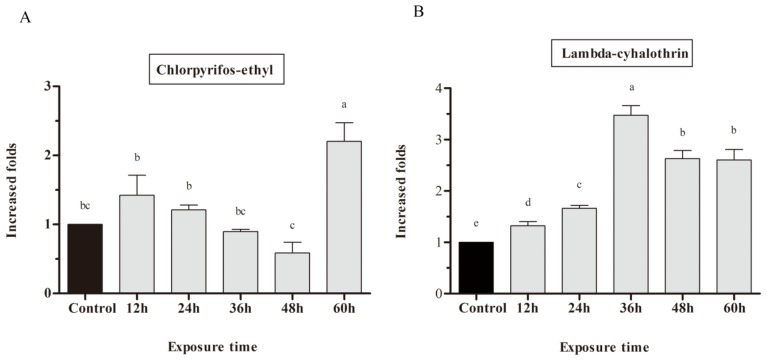
Figure 4.
Induction of C. pomonella CYP9A61. RT-qPCR analysis relative expression of CYP9A61 treated with 12.5 ng chlorpyrifos-ethyl (A) and 0.19 ng lambda-cyhalothrin (B). Expression level was first normalized to the reference gene beta-actin. The normalized value of each sample was then divided by a specified control (the value of CYP9A61 in acetone treated control), and the ratio was applied to relative expression analysis. The results are shown as the mean ± SE. The error bars show the ranges of standard errors. Letters on the error bars indicate the significant differences by ANOVA analysis (p < 0.05).

