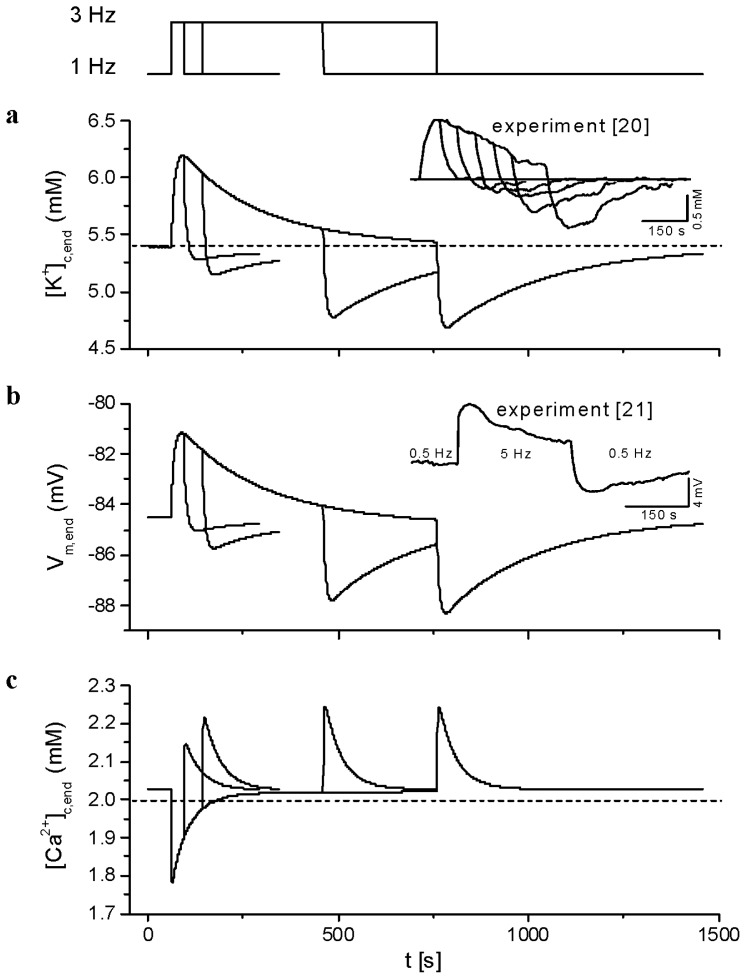
Figure 7.
Accumulation-depletion phenomena during and after a high frequency train of stimulations. From a period of stimulation at 1 Hz, a train of stimuli at 3 Hz has been applied for four different durations: 34, 144, 400 and 700 s. From up to down are plotted superimposed outputs of the model for the four durations: the timing of changes in the frequency of stimulation, the time course of changes in the end-diastolic values of cleft K+ concentration (a), membrane voltage (b) and cleft Ca2+ concentration (c). The horizontal dashed lines show the levels of corresponding ion concentrations in external bulk solution. The insets show the corresponding experimental records digitized from Kunze [20] and Attwell et al. [21].

