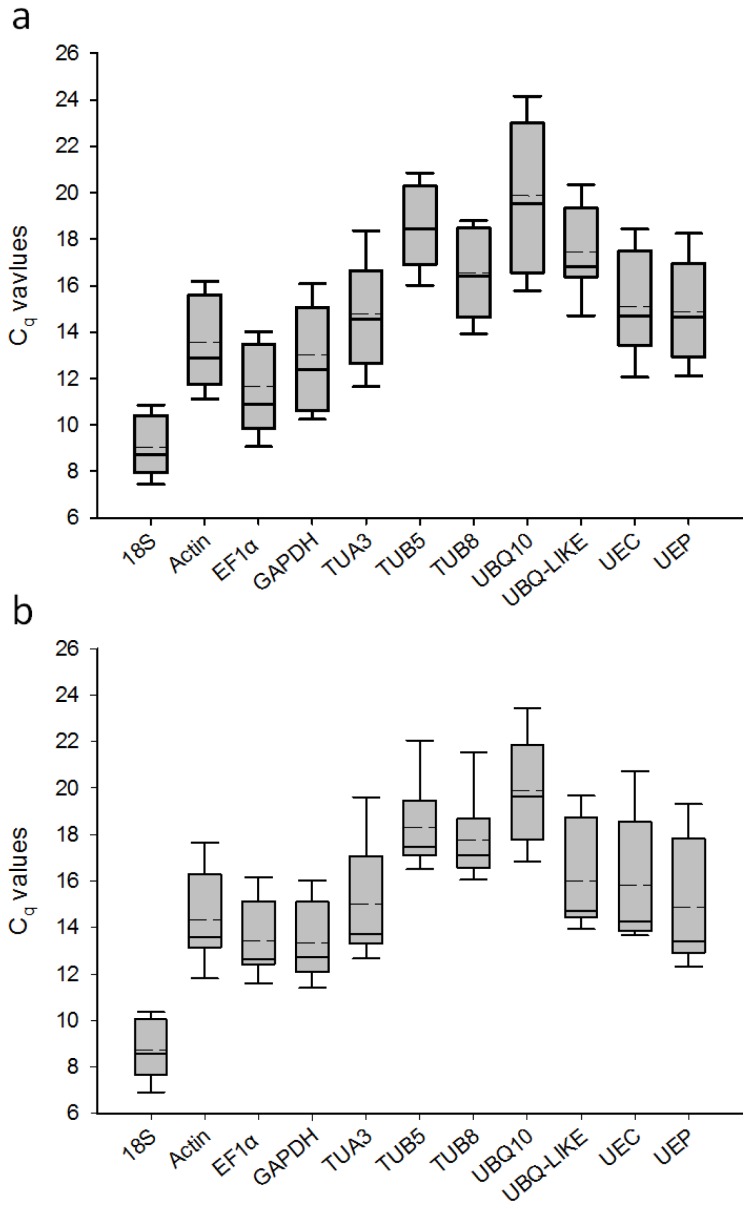
Figure 1.
Cq values of the 11 candidate reference genes in the RT-qPCR analysis (a) Eleven samples at two developmental stages; (b) Nine samples exposed to desiccation and cold stress treatments. The Cq values are shown as the first and third quartile. The vertical lines indicate the range of values. The median values are indicated by solid lines, and the mean values are indicated by broken lines.

