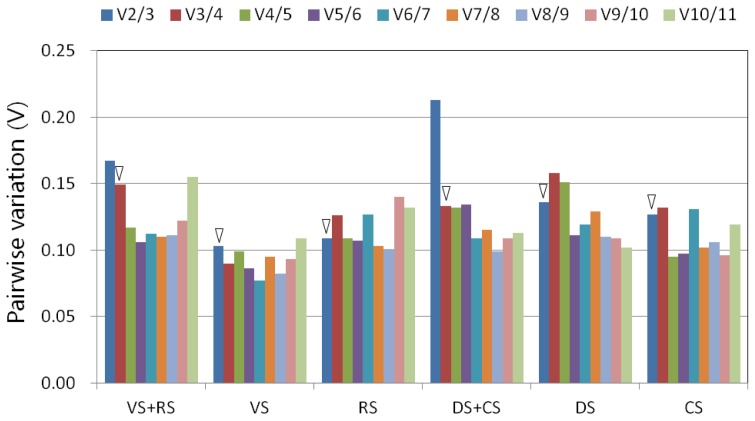
Figure 3.
Pairwise variation (V) analysis by qBasePLUS to determine the optimal number of reference genes needed for accurate normalization in all the tested samples. V values less than 0.15 indicate that no additional genes are needed to calculate a reliable normalization factor. The triangles indicate V values lower than 0.15. CS, cold stress; DS, desiccation stress; RS, reproductive stage; VS, vegetative stage.

